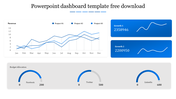
Magnificent Executive Dashboard PPT Template on Three Nodes

Executive dashboard slide featuring three dashboard dials with percentage readings in green, yellow, and red zones.
P.ID : 3931
    971 views
    114 Downloads
    Get Custom Slides by Experts
    Instantly Access Templates in PowerPoint
    Executive Dashboard PPT - Important Elements to Put Together Your Template 
    An executive dashboard PPT is a great marketing tool that will help you to convey your messages and to make your company look professional. Even though many companies are already utilizing the use of these types of PPTs, this article will discuss the best way to write an executive PPT and how you can ensure that your company can put it in full use. The first thing that you have to do is to provide information about your company's products or services and the company's services. The content should be well structured, including many keywords. You have to understand that your aim here is to provide informative content, with little or no sales pitch. When you want to draw people's attention, the essential piece of information that you need to make sure you put on your dashboard PPT is the sales pitch. 
    This helps to establish your credibility, and it will let your audience know what your company is all about. Just make sure that the relationship that you are giving out to include is easy to find, and that will not be too much for the readers to remember. To entice people to purchase your items, you should consist of the main idea or concept that will help the consumers to realize the value of your product. Use words that will inspire your readers to learn more about your products, and that will help them to be enticed into buying. After you have gone through the basics of your company and your products and services, you can try to add your slogan that will be the main idea for all consumers. Finally, you can finish off by providing the primary concept of your company if you want to be successful with this concept. This means that you need to get hold of the right font or graphics tool. 
    Advertisement

    You May Also Like These PowerPoint Templates

    Free
    Add to Wishlist
    Download
    AI Customize
    Dashboard graphic featuring a circular speedometer with a red needle, surrounded by text labels for various business metrics.
    Add to Wishlist
    Download
    AI Customize
    Speedometer slide with three colorful gauges showing percentages each with captions.
    Add to Wishlist
    Download
    AI Customize
    Dashboard with a red line graph for Jan-May and a bar chart of four colored percentage bars and category icons.
    Free
    Add to Wishlist
    Download
    AI Customize
    PowerPoint slide showcasing projected cash flows, NPV for 3 and 5 years, and payback period with client testimonial.
    Add to Wishlist
    Download
    AI Customize
    Three panel dashboard with column, bar, and funnel charts at the top and numbered blue boxes with text below.
    Free
    Add to Wishlist
    Download
    AI Customize
    Dashboard with line chart for appointments, bar chart from hospital earnings to patient totals, and intake by category.
    Add to Wishlist
    Download
    AI Customize
    Slide deck of energy dashboards displaying data visualizations like pie charts, bar and line graphs, in green shades.
    Free
    Add to Wishlist
    Download
    AI Customize
    KPI dashboard layout with blue semicircle gauges and line charts representing social media performance metrics.
    Free
    Add to Wishlist
    Download
    AI Customize
    Dashboard layout with three semicircular gauges in orange and brown tones, paired with captions, on a beige background.
    Add to Wishlist
    Download
    AI Customize
    Project management dashboard with bar charts, numerical data panels, and color-coded sections.
    Add to Wishlist
    Download
    AI Customize
    Dashboard-themed slide with semi-circle charts for business analysis, featuring metrics and reflective silhouettes at the bottom.
    Add to Wishlist
    Download
    AI Customize
    Bar chart infographic with four blue bars for kpi forecasts, a line graph overlay, and a man with a magnifying glass.
    Add to Wishlist
    Download
    AI Customize
    Executive dashboard slide featuring bar graphs and pie charts comparing project data over three years, with text boxes.
    Add to Wishlist
    Download
    AI Customize
    Four colored circular progress, one is higlighted in a box with a pie chart, and a bar chart labelled with sections.
    Add to Wishlist
    Download
    AI Customize
    Key performance indicator slide displaying data bars, percentages, and distinct icons in a structured layout.
    Add to Wishlist
    Download
    AI Customize
    Comprehensive program dashboard featuring charts and gauges for quality, budget, risks, overall project map, progress, and resource updates.
    Free
    Add to Wishlist
    Download
    AI Customize
    Four black speedometers with white numbers and yellow markers arranged in a two by two grid with descriptions.
    Add to Wishlist
    Download
    AI Customize
    KPI infographic slide deck, combining line and bar graphs,  pie charts, and performance dials for data representation.