executive dashboard powerpoint template slide for company

Executive dashboard slide featuring bar graphs and pie charts comparing project data over three years, with text boxes.
P.ID : 51470
    842 views
    113 Downloads
    Get Custom Slides by Experts
    Instantly Access Templates in PowerPoint

    Executive Dashboard PowerPoint Template Slide For Company

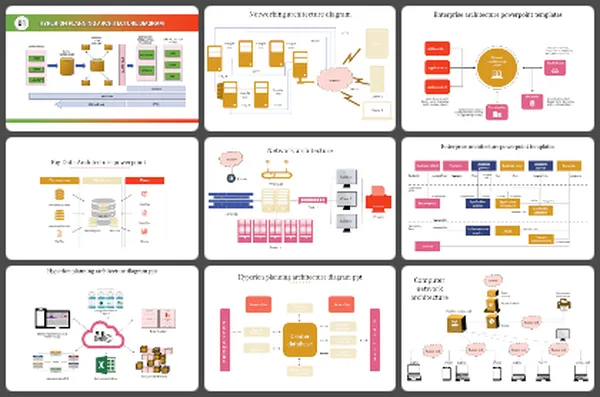
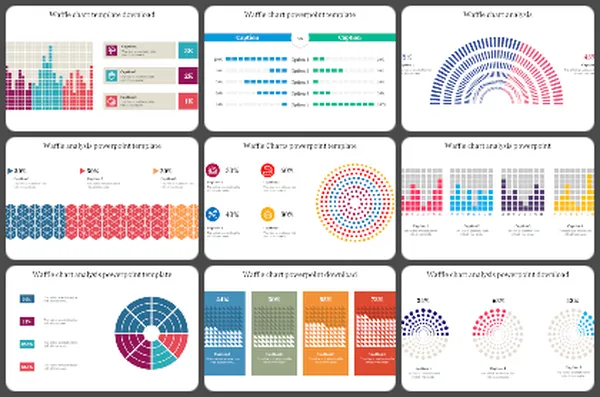
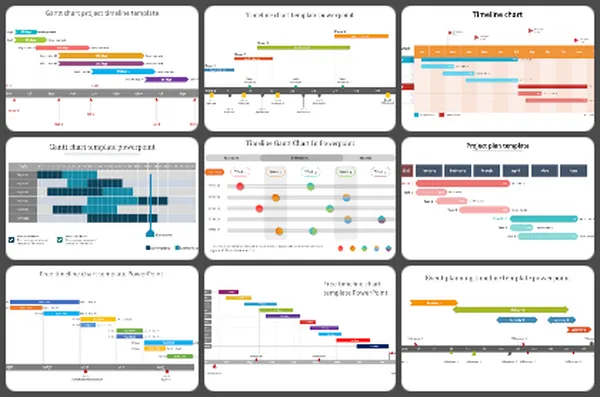
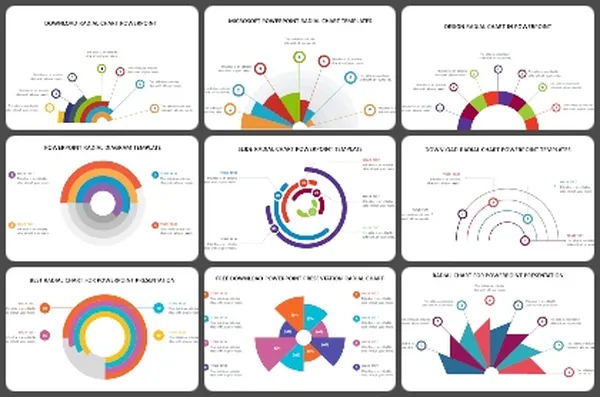
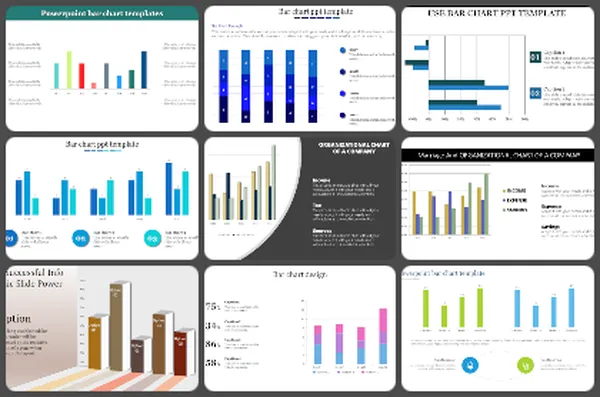
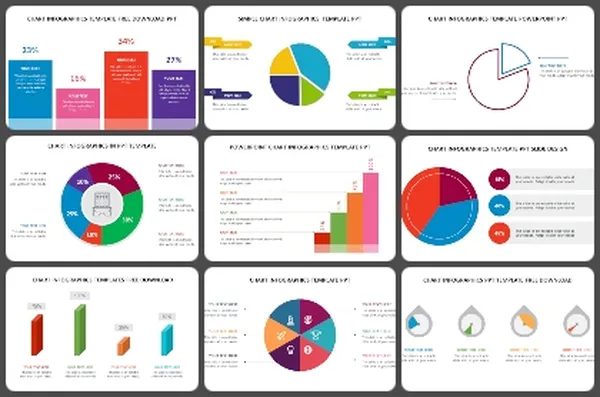
    This is an executive dashboard PowerPoint template slide. This executive template will help reveal revenue, cost, trends, cash flow diagrams, and other types of financial information. It can also be helpful for finance and sales-related icons for designing your slides. Utilize the given dashboard sample slides for revealing sales data, trends, information More...
    Advertisement

    You May Also Like These PowerPoint Templates

    Add to Wishlist
    Download
    AI Customize
    Credit score meter with a needle in the center, displaying risk levels on a gradient from yellow to blue with caption areas.
    Add to Wishlist
    Download
    AI Customize
    Sentiment meter infographic displaying six emotions in a colorful fan design, each labeled with placeholders text areas.
    Add to Wishlist
    Download
    AI Customize
    Project status dashboard slide displaying budgets and performance metrics for banners, social media, and brochures.
    Add to Wishlist
    Download
    AI Customize
    KPI Dashboard PowerPoint template displaying key metrics, including count of contracts, revenues, and costs.
    Add to Wishlist
    Download
    AI Customize
    Dashboard slide with two green gauge meters, each labeled with a caption and text below.
    Add to Wishlist
    Download
    AI Customize
    PowerPoint slide with a tachometer graphic showing numbers 1 through 8 in different colors, with placeholders for captions.
    Add to Wishlist
    Download
    AI Customize
    Tachometer slide with four gauges in orange, red, blue, and green, each with captions below describing different readings.
    Free
    Add to Wishlist
    Download
    AI Customize
    Two speedometers with red and purple needle pointers, with caption and corresponding colored dots below.
    Add to Wishlist
    Download
    AI Customize
    Tachometer template with percentage markers and color-coded designs, each paired with caption areas.
    Add to Wishlist
    Download
    AI Customize
    Microsoft dashboard slide showcasing supply chain costs, inventory to sales ratio, and carrying cost of inventory.
    Add to Wishlist
    Download
    AI Customize
    Colorful tachometer PowerPoint slide design with transportation icons including airplane, car, bus, and train with captions.
    Add to Wishlist
    Download
    AI Customize
    Dashboard with bar charts, line graphs, and a gauge chart in various colors and a percentage indicator, on white background.
    Add to Wishlist
    Download
    AI Customize
    Dashboard template displaying a project timeline with a Gantt chart, project details, and phases from initiation to closure.
    Add to Wishlist
    Download
    AI Customize
    Executive dashboard template showcasing growth, progress, and performance metrics for effective management.
    Add to Wishlist
    Download
    AI Customize
    PowerPoint slide featuring a project dashboard with bar charts and a pie chart displaying project data and progress.
    Add to Wishlist
    Download
    AI Customize
    Ten speedometer icons in two rows, each with blue, green, and red segments, ranging from 0 to 100.
    Add to Wishlist
    Download
    AI Customize
    Dashboard template with three fuel gauge icons, each showing different fuel levels with placeholder text.