Error Trend Analysis PowerPoint And Google Slides


1 / 11

Error Trend Analysis PowerPoint, Google Slides, and Canva Template
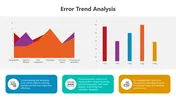
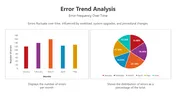
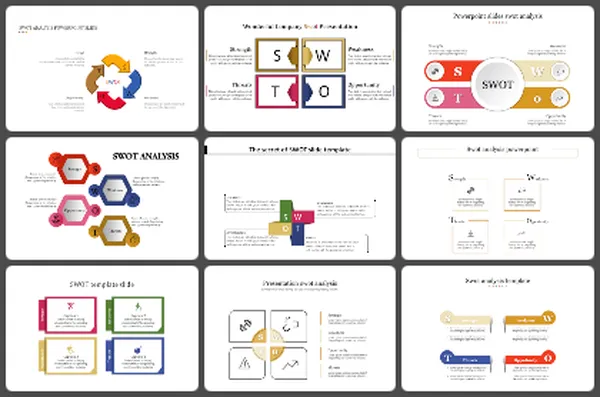
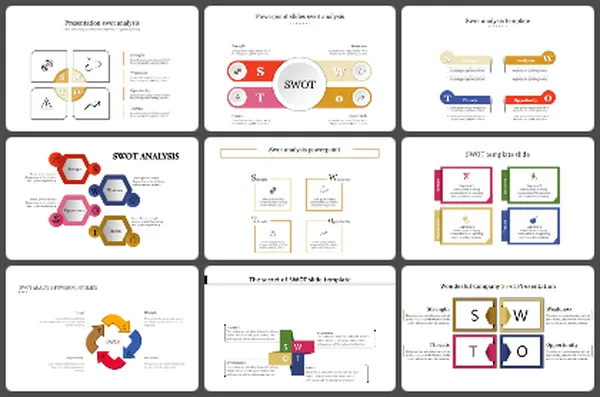
Error Trend Analysis (ETA) is a systematic approach used in quality control and risk management to identify , monitor , and reduce recurring errors within an organization. By analyzing error patterns over time, businesses can detect root causes, improve operational efficiency, and enhance compliance with industry standards . It plays a crucial role in reducing defects, improving process reliability, and minimizing risks in sectors like healthcare, manufacturing, IT, and finance.
Purpose Of The Slides
This 11-slide presentation deck , designed with a multicolor theme , More...
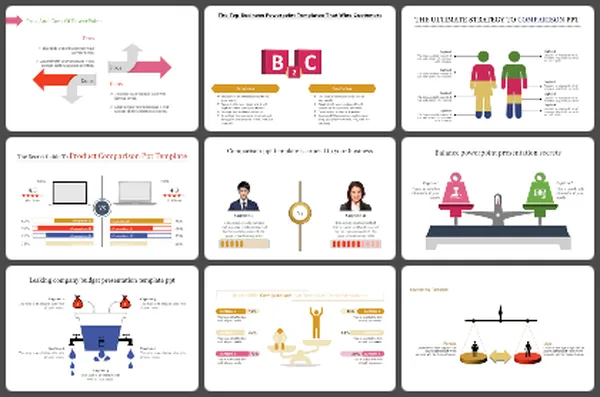
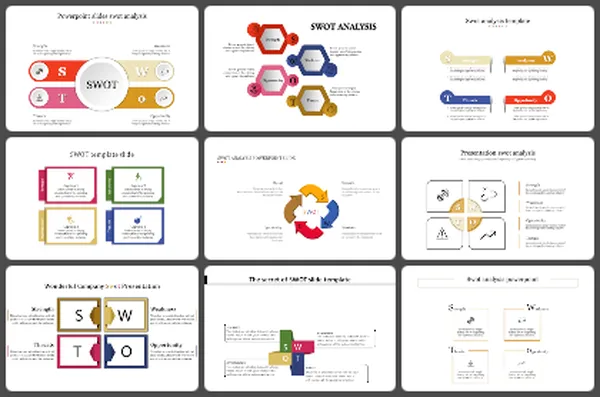
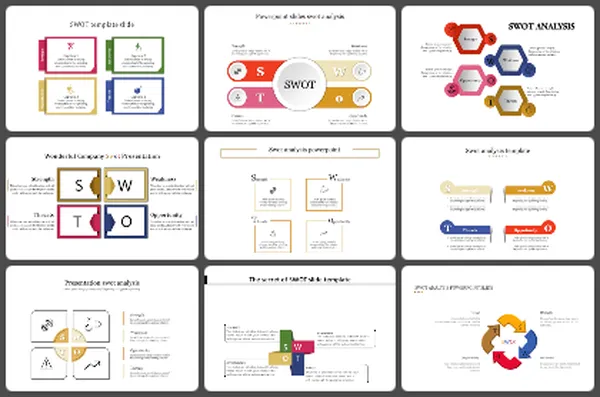
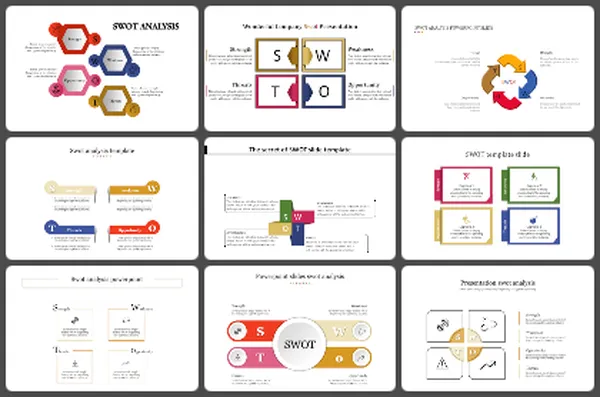
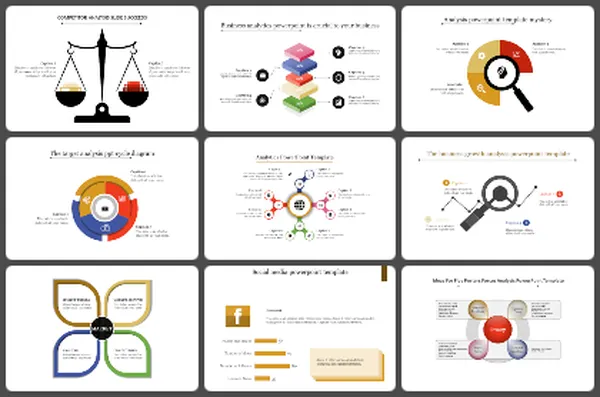
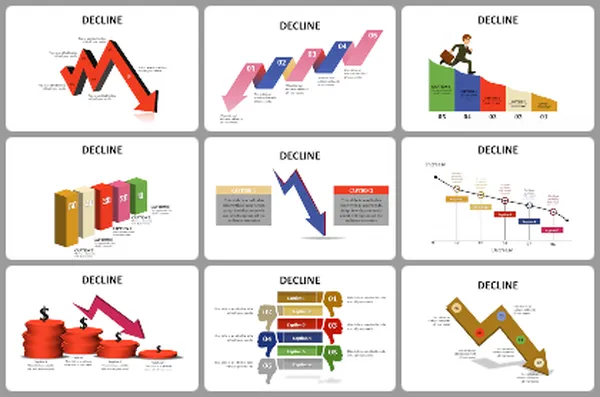
You May Also Like These PowerPoint Templates
Add to Wishlist
Download
AI Customize


Add to Wishlist
Download
AI Customize

Add to Wishlist
Download
AI Customize

Add to Wishlist
Download
AI Customize

Add to Wishlist
Download
AI Customize

Add to Wishlist
Download
AI Customize

Add to Wishlist
Download
AI Customize

Add to Wishlist
Download
AI Customize

Add to Wishlist
Download
AI Customize

Add to Wishlist
Download
AI Customize


Add to Wishlist
Download
AI Customize

Add to Wishlist
Download
AI Customize

Add to Wishlist
Download
AI Customize


Add to Wishlist
Download
AI Customize

Add to Wishlist
Download
AI Customize

Add to Wishlist
Download
AI Customize

Add to Wishlist
Download
AI Customize
