Environment KPIs Dashboard PowerPoint And Google Slides

 Canva
Canva

Environment KPIs Dashboard PowerPoint, Google Slides, and Canva Template
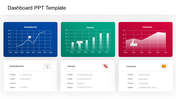
Environment KPIs Dashboard is a powerful tool designed to monitor, measure, and report key environmental performance indicators (KPIs). These dashboards consolidate critical sustainability metrics—such as carbon emissions, energy usage, water conservation, waste reduction, and recycling rates—into a single, easy-to-understand visual. By tracking these environmental indicators, businesses and organizations can better align their operations with sustainable development goals and environmental compliance standards.
Purpose Of The Slides
This single-slide template, crafted with a clean green color theme, offers a visually impactful layout to showcase your environmental KPIs effectively. The dashboard layout includes customizable data charts, graphs, and icons, making it easy to present complex environmental data in a simplified format. Whether you are creating internal reports, stakeholder presentations, or ESG performance reviews, this slide is an ideal choice for delivering insights clearly and professionally.
Who Can Use It?
This environment KPIs dashboard slide is ideal for sustainability managers, ESG analysts, environmental consultants, green project coordinators, and educators. It's also suitable for corporate CSR teams, non-profits, and businesses aiming to communicate their green metrics to stakeholders in a compelling way.
Special Key Features
Download the Environment KPIs Dashboard slide now to bring clarity and impact to your sustainability reporting—supporting your organization’s commitment to environmental responsibility.
Features of this template
- 100% customizable slides and easy to download.
- The slides contain 16:9 and 4:3 formats.
- Easy to change the colors quickly.
- Highly compatible with PowerPoint, Google Slides, and Canva templates.


You May Also Like These PowerPoint Templates
Add to Wishlist
Download
AI Customize

Add to Wishlist
Download
AI Customize

Add to Wishlist
Download
AI Customize

Add to Wishlist
Download
AI Customize

Add to Wishlist
Download
AI Customize

Add to Wishlist
Download
AI Customize


Add to Wishlist
Download
AI Customize

Add to Wishlist
Download
AI Customize

Add to Wishlist
Download
AI Customize

Add to Wishlist
Download
AI Customize

Add to Wishlist
Download
AI Customize

Add to Wishlist
Download
AI Customize

Add to Wishlist
Download
AI Customize

Add to Wishlist
Download
AI Customize

Add to Wishlist
Download
AI Customize


Add to Wishlist
Download
AI Customize

Add to Wishlist
Download
AI Customize

Add to Wishlist
Download
AI Customize
