Empathy Map PowerPoint And Google Slides Template

Pack of 11 slides
P.ID : 73405
Advertisement
57 views
20 Downloads
Get Custom Slides by Experts
Instantly Access Templates in PowerPoint

Empathy Map PPT, Google Slides, and Canva Template


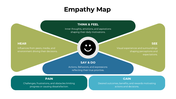
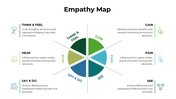
An Empathy Map is a visual tool used to understand your audience’s emotions, thoughts, and behaviors. It provides insights into their needs, motivations, and challenges, helping professionals and students develop user-centered strategies. This single-slide deck simplifies the process of creating an Empathy Map, making it easy to share and analyze audience insights effectively.

Purpose Of The Slides

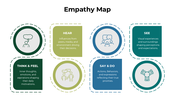
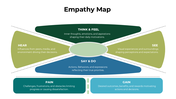
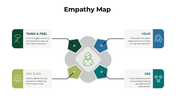
This slide is designed to help you present the concept of an Empathy Map clearly and efficiently. With an infographic layout and a multicolor theme, it visually organizes information, focusing on key areas such as what your audience thinks, feels, says, and does. Perfect for brainstorming sessions, audience analysis, and project planning.

Who Can Use It?

Ideal for marketing professionals, UX designers, project managers, educators, and students, this slide is a versatile tool for anyone looking to deepen their understanding of target users or audiences. Whether you’re preparing a team workshop, delivering a class presentation, or refining your project approach, this slide provides a structured and visually engaging format.

Special Key Features?

This Empathy Map slide is fully editable and designed to make complex ideas simple and engaging. Its infographic style and professional multicolor theme ensure clarity and impact.Enhance your audience analysis with this comprehensive Empathy Map slide. Download the full 16-slide deck today, compatible with PowerPoint, Google Slides, and Canva, and create user-focused strategies effortlessly!

Features of this template

  • 100% customizable slides and easy to download.
  • The slides contain 16:9 and 4:3 formats.
  • Easy to change the colors quickly.
  • Highly compatible with PowerPoint, Google Slides, and Canva templates.

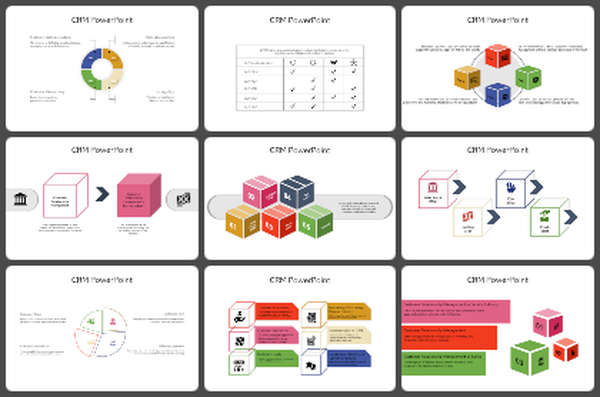
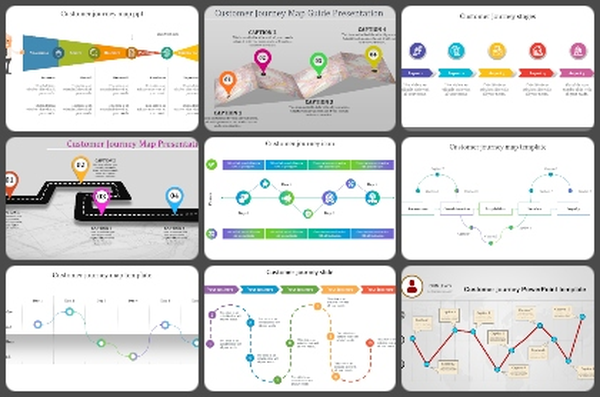
You May Also Like These PowerPoint Templates

Add to Wishlist
Download
AI Customize
Figures presenting pie and bar charts on a screen, with six slide deck showing various marketing customer analysis layouts.
Add to Wishlist
Download
AI Customize
Add to Wishlist
Download
AI Customize
Add to Wishlist
Download
AI Customize
Five funnel visual for customer acquisition,  from planning to sales, represented in various colours with caption areas.
Add to Wishlist
Download
AI Customize
Slide pack showing likert scale from green to red with emojis and captions, along with additional related charts and metrics.
Add to Wishlist
Download
AI Customize
Multicolored circular design with six numbered segments, each linked to icons on the outer ring, and captions on sides.
Free
Add to Wishlist
Download
AI Customize
Add to Wishlist
Download
AI Customize
Colorful pyramid diagram slide depicting key areas of customer needs analysis with a trophy icon at the top with text areas.
Add to Wishlist
Download
AI Customize
Customer onboarding slide with five numbered hexagons with arrows in various colors, surrounding a central icon.
Add to Wishlist
Download
AI Customize
Infographic showing user acquisition process divided into four color-coded stages with titles and brief descriptions.
Add to Wishlist
Download
AI Customize
Slide deck with three customer avatars, each with different hairstyles and clothing, representing various customer types.
Add to Wishlist
Download
AI Customize
Four vertical rectangles in red, blue, purple, and violet with diamond shapes, representing steps.
Add to Wishlist
Download
AI Customize
Stacked horizontal bars with angled ends in purple, blue, teal, red, and yellow overlaid on gray text sections.
Add to Wishlist
Download
AI Customize
Add to Wishlist
Download
AI Customize
Customer onboarding slide with an illustration of people reviewing customer profiles and five onboarding steps.
Add to Wishlist
Download
AI Customize
Add to Wishlist
Download
AI Customize
Customer acquisition template with five pie charts showing different percentages labeled, each with an icon and caption area.