Editable Diagrams For Google Slides Presentation
Editable Google Slides Chart Template For Presentation
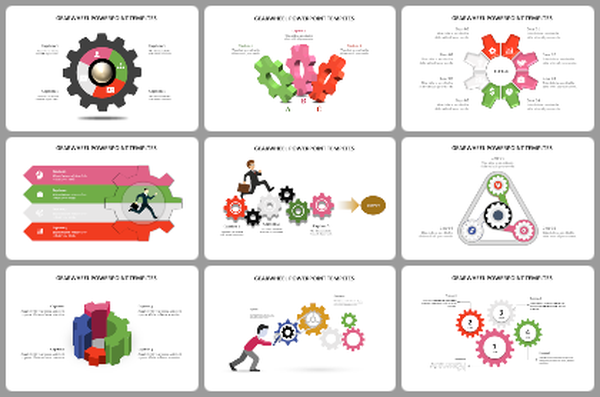
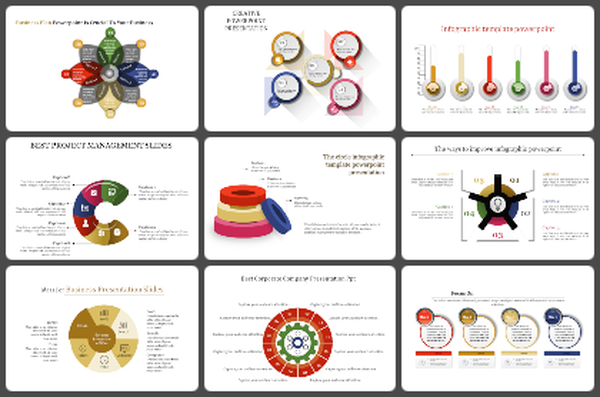
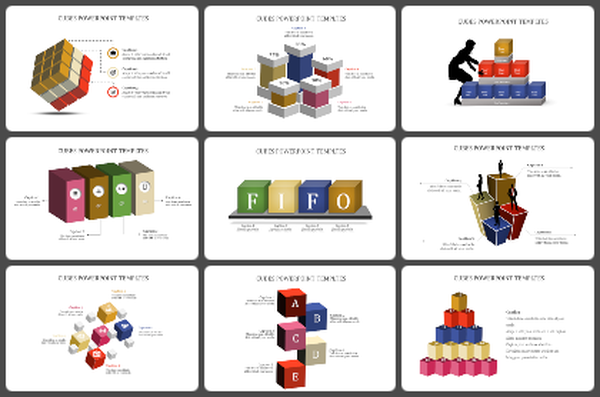
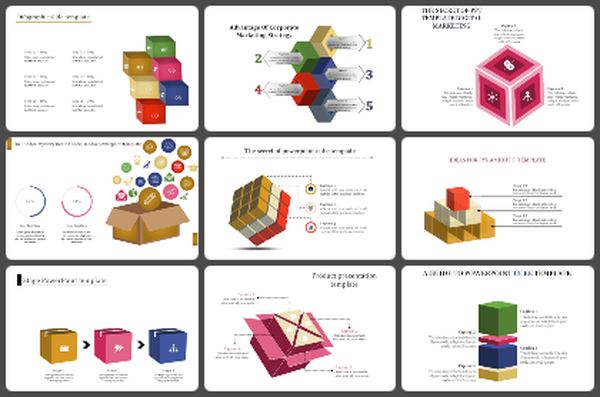
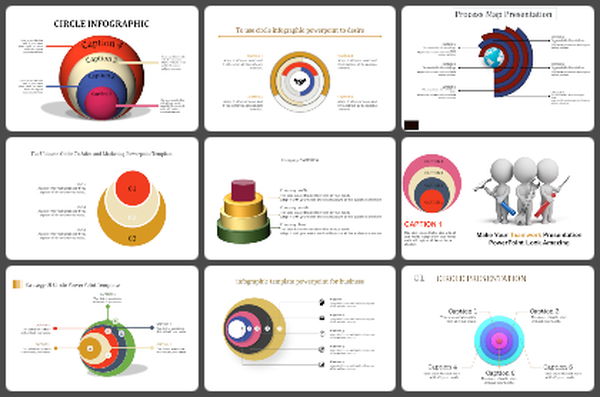
How can editable diagrams make presentations more interesting? Cool! Explore our editable diagrams for Google Slides presentations and make your work simple. It is 100% customizable so you can alter it in any way you want, as the design is flexible for use in your presentation. You will realize how helpful they are in creating meaningful content with appealing graphics in a jiffy. Try it now!
Purpose of the Slide
Whether you're explaining your work process, illustrating a plan, or showing some statistics, our attractive circle diagrams templates can help a lot.
About the Slide
It features a basic loop diagram for making your ideas easier to follow. The horizontal design helps in showcasing your ideas in a visually appealing way with clarity. Above all, the five icons represent different stages and organize your content to keep your audience engaged.
Who Can Use It?
This slide is valuable for marketing professionals, educators, and anyone who works in companies or studies in universities. With the help of these easily editable diagrams, you can adjust the visuals when presenting a business proposal, giving a lecture, or presenting research results.
Don’t miss out on our Freebie of the Week: Customizable diagrams for presentations!
Features of the template:
- 100% customizable slides and easy to download.
- The slides contain 16:9 and 4:3 formats.
- Easy to change the colors quickly.
- It is a 100% pre-designed slide.
- Highly compatible with PowerPoint, Google Slides and Canva templates.
You May Also Like These PowerPoint Templates
Free
Free
Free


