Dunn and Kruger Curve Effect PowerPoint Template

Graph representation of the Dunning Kruger effect, mapping confidence levels from know nothing to expert across four stages.
P.ID : 59249
    350 views
    32 Downloads
    Get Custom Slides by Experts
    Instantly Access Templates in PowerPoint

    Dunning Kruger Effect Presentation Slide


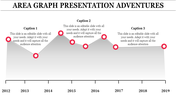
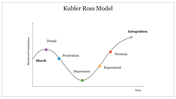
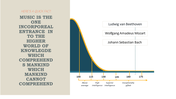
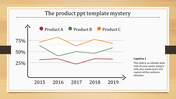
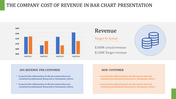
    The Dunning Kruger Effect is a cognitive bias in which people with low ability or knowledge tend to overestimate their competence. This can lead to poor decision-making and mistakes, particularly in professional settings. Our template effectively represents this effect through a graph that showcases the peak, slope, and other points, providing a visual aid to help the audience understand the concept. If you want to communicate complex data and ideas effectively, try incorporating this type of graph in your business.


    Features of the template

    • 100% customizable slides and easy to download.
    • Slides are available in different nodes & colors.
    • The slide contains 16:9 and 4:3 formats.
    • Easy to change the colors of the slide quickly.
    • Well-crafted template with an instant download facility.
    • Highly compatible with PowerPoint and Google Slides.
    • The clear layout of this template will help you to design a professional-looking presentation.
    • A better way to present your report.
    Advertisement

    You May Also Like These PowerPoint Templates

    Add to Wishlist
    Download
    AI Customize
    Slide showing a graph of the Dunning-Kruger Effect with stages from knowing nothing to becoming an expert with a title text.
    Add to Wishlist
    Download
    AI Customize
    Narrative arc slide displaying key plot stages with placeholder text areas.
    Add to Wishlist
    Download
    AI Customize
    Line graph slide with two data series in red and yellow, showing item based data fluctuations and a text caption.
    Add to Wishlist
    Download
    AI Customize
    Graph showing an upward curve with captions along key points, indicating growth or improvement over time.
    Add to Wishlist
    Download
    AI Customize
    Curve Graph PPT Template & Google Slides for Presentation
    Add to Wishlist
    Download
    AI Customize
    A collection of story arc slides featuring graphs illustrating rising action, climax, and resolution points for storytelling.
    Add to Wishlist
    Download
    AI Customize
    An S shaped curve graph with three key points, illustrating growth or change over time with captions.
    Add to Wishlist
    Download
    AI Customize
    Best Positively Skewed Histogram Presentation Slide
    Add to Wishlist
    Download
    AI Customize
    A bell curve chart slide with an orange shaded area representing percentages for standard deviations.
    Add to Wishlist
    Download
    AI Customize
    A four quadrant graph with colorful sections labeled from 01 to 04 in the center. Each quadrant has placeholder text area.
    Add to Wishlist
    Download
    AI Customize
    Graph representation of the Dunning Kruger effect, mapping confidence levels from know nothing to expert across four stages.
    Add to Wishlist
    Download
    AI Customize
    Editable Kano Model PowerPoint and Google Slides Themes
    Add to Wishlist
    Download
    AI Customize
    Bradley curve chart with four sections in shades of maroon, and orange, illustrating progression through stages.
    Add to Wishlist
    Download
    AI Customize
    Crossing the Chasm PowerPoint Template and Google Slides
    Add to Wishlist
    Download
    AI Customize
    Graph illustrating the law of diminishing marginal return with a curved line between input and output, with labeled sections.
    Add to Wishlist
    Download
    AI Customize
    Graphical representation of a story arc showing stages from exposition to resolution, with labeled points for each action.
    Add to Wishlist
    Download
    AI Customize
    Best Plot Diagram PowerPoint and Google Slides Themes