Free - Best Drive Presentation Templates PowerPoint Slide

Free
A graph showing various business aspects with percentages for each from profit model to customer engagement on a blue theme.
P.ID : 36364
    223 views
    69 Downloads
    Get Custom Slides by Experts
    Instantly Access Templates in PowerPoint

    Simple Data Theme PowerPoint Templates


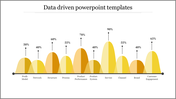
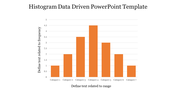
    Unleash the power of data with our Data-Driven Analytics PowerPoint Templates. These templates aren't just ordinary slides; they're your secret weapon for data-driven success. Crafted for professionals and accessible to all, our templates simplify intricate data into captivating visual stories. Say goodbye to dull numbers and hello to vibrant, engaging presentations. Charts, graphs, and infographics are at your fingertips, simplifying complex concepts and turning data into a compelling narrative. With a user-friendly approach and a range of themes, your message shines through effortlessly. Let your data shine as you transform it into compelling art, making learning enjoyable and decision-making seamless. Experience the world of data with our complimentary infographics templates and witness your presentations come to life.


    Features of this template:

    • 100% customizable slides and easy to download.
    • Slides available in different nodes & colors.
    • The slide contained 16:9 and 4:3 format.
    • Easy to change the slide colors quickly.
    • Well-crafted template with instant download facility.
    Advertisement

    You May Also Like These PowerPoint Templates

    Add to Wishlist
    Download
    AI Customize
    Data driven marketing slide illustrating a circular process with four steps harvest, analyze, activate, and optimize.
    Add to Wishlist
    Download
    AI Customize
    A colorful bar graph showing data driven insights with categories along with their corresponding percentages.
    Add to Wishlist
    Download
    AI Customize
    Data driven slides featuring various data visualizations, including charts and graphs with different colored layout designs.
    Add to Wishlist
    Download
    AI Customize
    Data driven slide featuring a colorful chart with percentage values, showing a timeline from 4m to 6m with placeholder text.
    Add to Wishlist
    Download
    AI Customize
    Data driven slide displaying five key areas on a colorful circle with icons and text description.
    Free
    Add to Wishlist
    Download
    AI Customize
    Preventive maintenance illustration featuring yellow peaks with icons and labels for different stages.
    Add to Wishlist
    Download
    AI Customize
    Four step process for data driven marketing with color coded text boxes and description.
    Free
    Add to Wishlist
    Download
    AI Customize
    Bar chart with overlapping orange and peach shades depicting percentages for various categories on a white background.
    Add to Wishlist
    Download
    AI Customize
    Diagram showing percentages for date driven financing, marketing, teamwork, and scheduling, with icons and a radar chart.
    Free
    Add to Wishlist
    Download
    AI Customize
    Drive presentation slide showing layered area chart with metrics from profit model to customer engagement on a purple theme.
    Free
    Add to Wishlist
    Download
    AI Customize
    Red gradient mountain peak shapes on a white layout, showing varied heights for percentage data analysis.
    Free
    Add to Wishlist
    Download
    AI Customize
    Drive business presentation slide with a yellow line graph displaying varying percentages for ten key business categories.
    Free
    Add to Wishlist
    Download
    AI Customize
    Drive presentation template with orange gradient bell curves representing data percentages, on a red footer section.
    Add to Wishlist
    Download
    AI Customize
    Data driven PowerPoint slide featuring a line graph with three data sets and colorful circular progress indicators below.
    Add to Wishlist
    Download
    AI Customize
    The Future Of Data Catalogs PPT and Google Slides Themes
    Add to Wishlist
    Download
    AI Customize
    A data driven slide featuring a bar graph with categories A, B, C, D, and E, displaying percentages across various scores.
    Add to Wishlist
    Download
    AI Customize
    Editable Data Driven Presentation Template With Charts