download powerpoint design chart infographics model

PowerPoint slide with colorful bar chart infographic representing different percentages on a white backdrop.
P.ID : 49822
    421 views
    68 Downloads
    Get Custom Slides by Experts
    Instantly Access Templates in PowerPoint

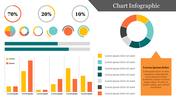
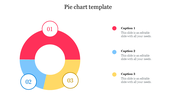
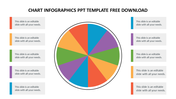
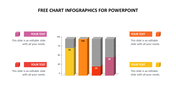
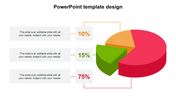
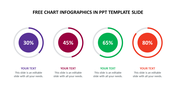
    Effective chart Infographic Template


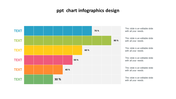
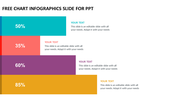
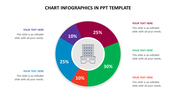
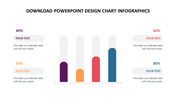
    Try this chart infographic PPT to design your infographic presentation. The template is added with four nodes designed in bar technique format with multiple colors. The user can use the text area to explain the topic in nodes. The professional design's colors intimidate the audience and give an advantage to the presentation. This chart template is fully customized, so editing is a piece of cake for the user. Make sure to try this creative template and make quick success. Try now!

    Feature of the Template

    • 100% customizable slides
    • Easy to change the slide colors quickly.
    • It is easy to download.
    • Slides are available in different nodes & colors.
    • The slide contained 16:9 and 4:3 formats.
    • Well-crafted template with instant download facility.
    • Creative design with text area.
    Advertisement

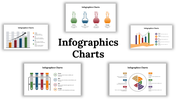
    You May Also Like These PowerPoint Templates

    Free
    Add to Wishlist
    Download
    AI Customize
    3D pie chart slide showing five colored segments with percentages each labeled with placeholder text.
    Add to Wishlist
    Download
    AI Customize
    A slide showing four colorful triangles labeled with percentages representing effect, planning, execution, and hard work.
    Add to Wishlist
    Download
    AI Customize
    Progress bar template with three steps, indicating the completion status for each step using green, blue, and red colors.
    Add to Wishlist
    Download
    AI Customize
    A slide with a progress bar at 50% completion with multicolored segments and caption areas in a white backdrop with a title.
    Add to Wishlist
    Download
    AI Customize
    PowerPoint Bubble Chart Presentation and Google Slides
    Add to Wishlist
    Download
    AI Customize
    Colorful bar graph infographic slide representing five levels of process maturity, each labeled and iconified with captions.
    Add to Wishlist
    Download
    AI Customize
    Bass Diffusion Model PPT Template and Google Slides
    Add to Wishlist
    Download
    AI Customize
    Five donut shaped progress indicators in various colors with percentage, each with numbered text areas.
    Add to Wishlist
    Download
    AI Customize
    Line graph showing the dunning-kruger effect with peaks and valleys labeled as confidence and competence grow.
    Add to Wishlist
    Download
    AI Customize
    Best Business Environment PowerPoint Presentation Slide
    Add to Wishlist
    Download
    AI Customize
    Spider web template featuring a multi-colored radar chart in the center with four labeled icon sections at the corners.
    Add to Wishlist
    Download
    AI Customize
    Spider web diagram with two data points represented in orange and black, and two caption boxes on the left.
    Add to Wishlist
    Download
    AI Customize
    Effective Quad Chart Presentation Download
    Add to Wishlist
    Download
    AI Customize
    Innovative Pie Charts PowerPoint Presentation Template
    Add to Wishlist
    Download
    AI Customize
    Check out stunning Spider Web Chart PowerPoint Slide
    Add to Wishlist
    Download
    AI Customize
    Practical Metric Chart PowerPoint Presentation Template