Free - Doughnut Chart PowerPoint Template and Google Slides
Free


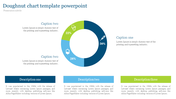
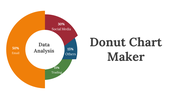

Doughnut Chart Presentation Slide
Here we present our well-designed doughnut chart PowerPoint template, featuring a circular chart design with a hole in the center, similar to a pie chart. With this slide, you can compare data effortlessly. Give it a try!
Purpose of the slide
Doughnut charts are useful for comparing data sets that have distinct categories. Using this slide can help you keep your audience engaged throughout your presentation.
About the slide design
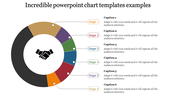
Doughnut charts display data with different percentage marks of different colors. Each section represents a percentage or fraction of the total. The hole in the center can be used to display additional information or to make the chart more visually appealing.
Download now and customize it for free!
Features of the Template:
- 100% customizable slides and easy to download.
- Easy to change the slide's colors.
- The slide is contained in 16:9 and 4:3 formats.
- Highly compatible with PowerPoint and Google Slides.
- This slide has a colorful design pattern.


You May Also Like These PowerPoint Templates

Add to Wishlist
Download
AI Customize

Add to Wishlist
Download
AI Customize

Add to Wishlist
Download
AI Customize

Add to Wishlist
Download
AI Customize

Add to Wishlist
Download
AI Customize

Add to Wishlist
Download
AI Customize

Add to Wishlist
Download
AI Customize

Add to Wishlist
Download
AI Customize

Add to Wishlist
Download
AI Customize

Add to Wishlist
Download
AI Customize

Add to Wishlist
Download
AI Customize

Add to Wishlist
Download
AI Customize


Add to Wishlist
Download
AI Customize

Free
Add to Wishlist
Download
AI Customize

Add to Wishlist
Download
AI Customize

Add to Wishlist
Download
AI Customize

Add to Wishlist
Download
AI Customize

Add to Wishlist
Download
AI Customize
