Free - Doughnut Chart PowerPoint And Google Slides Template
Free

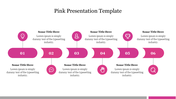

Doughnut Chart Presentation Slide
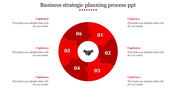
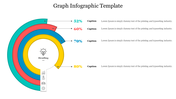
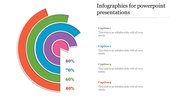
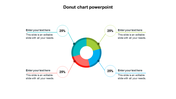
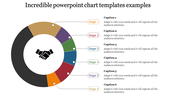
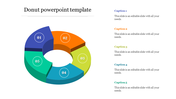
Introducing the Doughnut Chart PPT – your gateway to visually engaging data presentations! Often misunderstood, the Doughnut Chart is elegantly defined here as a captivating visualization tool that simplifies complex data. With our template, you can effortlessly transform your information into a captivating story. Don't miss the opportunity to make your data shine – unlock the potential of Pie Charts today! Explore the possibilities with our six-layered, multicolored doughnut image, illustrating the depth and versatility of this chart type.
Features of the template
- 100% customizable slides and easy to download.
- Slides are available in different colors
- The slide has 4:3 and 16:9 formats.
- Easy to change the slide colors quickly.
- Appealing Presentation to impress an audience.
- Create feature-rich slide presentations.
- An eye-pleasing color slide helps to give a catchy display.


You May Also Like These PowerPoint Templates
Add to Wishlist
Download
AI Customize

Add to Wishlist
Download
AI Customize


Add to Wishlist
Download
AI Customize


Add to Wishlist
Download
AI Customize

Add to Wishlist
Download
AI Customize

Add to Wishlist
Download
AI Customize

Add to Wishlist
Download
AI Customize

Add to Wishlist
Download
AI Customize

Add to Wishlist
Download
AI Customize

Add to Wishlist
Download
AI Customize

Add to Wishlist
Download
AI Customize

Add to Wishlist
Download
AI Customize


Add to Wishlist
Download
AI Customize

Free
Add to Wishlist
Download
AI Customize

Add to Wishlist
Download
AI Customize

Add to Wishlist
Download
AI Customize
