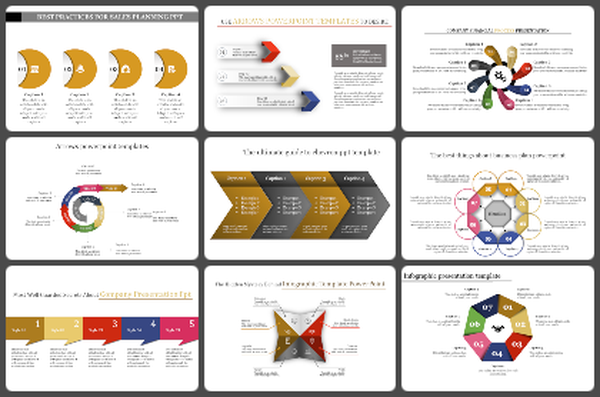
Awesome Descriptive Statistics PowerPoint And Google Slides
Descriptive Statistics Presentation Slides
In the vast expanse of Statistical analysis, Descriptive Statistics emerges as the bedrock. It simplifies and distills enormous datasets into graspable patterns and metrics. Visualize it as the prism translating raw data into discernible snapshots, emphasizing Measures of central tendency, variability, and distributions. It's the backbone of Data analysis, crafting a lucid image of datasets and paving the way for informed choices. Whether you're a data neophyte, a student, or a seasoned analyst, mastering these foundational statistics is indispensable. Now, pondering on this template's audience? It's curated for everyone from novice statisticians to seasoned data professionals. Each slide is designed to demystify complex statistical concepts, seamlessly converting dense data into understandable visuals. With adaptability at its core, it allows your unique insights to take center stage. This template isn’t just a tool—it's a transformative medium. Embolden your presentations, ignite audience intrigue, and guide them through the compelling world of Descriptive Statistics.
Features of the templates:
- 100% customizable slides and easy to download.
- Slides are available in different nodes & colors.
- The slide contained 16:9 and 4:3 formats.
- Easy to change the slide colors quickly.
- It is a well-crafted template with an instant download facility.
- Highly compatible with PowerPoint and Google Slides.


