Usable Data Science Lifecycle PPT And Google Slides Template

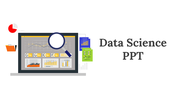


Data Science PowerPoint Slide
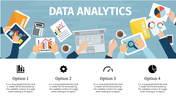
Get this creative and good-looking data science PowerPoint template to design an incredible presentation as quickly as a flash! Data Science is a data study field that will help businesses to extract meaningful insights from data. It helps analyze and determine the correct data set for actionable insights. You can use this technology slide to present the basic concepts of data science. It has a simple layout with clean and organized graphics and text holders, which will make your presentations professional. It is also easy to edit. Download now to hit the spot!
Features of this template
- 100% customizable slides and easy to download.
- The slide contains 16:9 and 4:3 formats.
- Easy to change the colors of the slide quickly.
- Highly compatible with PowerPoint and Google Slides.


You May Also Like These PowerPoint Templates
Add to Wishlist
Download
AI Customize

Add to Wishlist
Download
AI Customize
Add to Wishlist
Download
AI Customize

Add to Wishlist
Download
AI Customize

Add to Wishlist
Download
AI Customize

Add to Wishlist
Download
AI Customize

Add to Wishlist
Download
AI Customize

Add to Wishlist
Download
AI Customize

Add to Wishlist
Download
AI Customize

Add to Wishlist
Download
AI Customize

Add to Wishlist
Download
AI Customize

Add to Wishlist
Download
AI Customize

Add to Wishlist
Download
AI Customize

Add to Wishlist
Download
AI Customize

Add to Wishlist
Download
AI Customize

Add to Wishlist
Download
AI Customize

Add to Wishlist
Download
AI Customize

Add to Wishlist
Download
AI Customize

Add to Wishlist
Download
AI Customize

Add to Wishlist
Download
AI Customize
