Data Driven PowerPoint and Google Slides Templates

Pack of 13 slides
P.ID : 34695
Advertisement
745 views
79 Downloads
Get Custom Slides by Experts
Instantly Access Templates in PowerPoint

Data Driven Presentation Slides

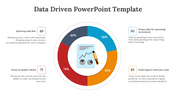
Being data-driven means making informed decisions and deriving insights from data analysis. It involves collecting, analyzing, and interpreting data to gain valuable insights and drive strategic actions. By harnessing the power of data, businesses can identify trends, understand customer behavior, optimize processes, and improve overall performance. Let's embrace the data-driven approach, leverage the template, and unlock the potential of data to propel growth and success.


Features of the templates:

    • 100% customizable slides and easy to download.
    • Slides are available in different nodes & colors.
    • The slide contains 16:9 and 4:3 formats.
    • Easy to change the colors of the slide quickly.
    • Highly compatible with PowerPoint and Google Slides.
    • Well-crafted template with an instant download facility.

    You May Also Like These PowerPoint Templates

    Add to Wishlist
    Download
    AI Customize
    Data driven slide with layered concentric circles displaying percentages on an orange gradient.
    Add to Wishlist
    Download
    AI Customize
    A data driven PPT slide featuring concentric circles with percentages, each representing a different section with text.
    Free
    Add to Wishlist
    Download
    AI Customize
    Slide with red triangular peaks representing various business metrics and percentage values at the base.
    Add to Wishlist
    Download
    AI Customize
    Data driven slide with three vertical bars in green, blue, and yellow, each with circular progress charts and percentage.
    Add to Wishlist
    Download
    AI Customize
    Presentation chart showing ten labeled categories with colorful peaks and corresponding percentage values below.
    Add to Wishlist
    Download
    AI Customize
    Data driven presentation slide featuring a 3D pie chart, labeled percentages, a numbered legend, and a bold 30% figure.
    Free
    Add to Wishlist
    Download
    AI Customize
    Data driven blue peak chart with labeled sections such as Profit Model, Network, and Brand, with percentages above.
    Free
    Add to Wishlist
    Download
    AI Customize
    Slide showing a 3D bar chart with teal bars, featuring two figures standing next, and four numbered captions on the right.
    Add to Wishlist
    Download
    AI Customize
    Data driven infographic with six colorful peaks, labeled percentages, fact name tags, and a descriptive footer.
    Add to Wishlist
    Download
    AI Customize
    Six colorful mountain peaks in yellow, blue, pink, green, orange, and purple, each containing an icon and captions.
    Free
    Add to Wishlist
    Download
    AI Customize
    Data Driven PowerPoint Templates and Google Slides
    Add to Wishlist
    Download
    AI Customize
    Five colored sections in green , orange, purple, yellow, and teal, showing different marketing strategies in a row.
    Add to Wishlist
    Download
    AI Customize
    Slide featuring a histogram chart with orange bars across seven categories, presented on a white background.
    Free
    Add to Wishlist
    Download
    AI Customize
    A graph showing various business aspects with percentages for each from profit model to customer engagement on a blue theme.
    Free
    Add to Wishlist
    Download
    AI Customize
    Slide illustrating a stepwise infographic with colored blocks, each representing different stages with text area.
    Add to Wishlist
    Download
    AI Customize
    Data driven marketing slide illustrating a circular process with four steps harvest, analyze, activate, and optimize.
    Add to Wishlist
    Download
    AI Customize
    A colorful bar graph showing data driven insights with categories along with their corresponding percentages.
    Add to Wishlist
    Download
    AI Customize
    Data driven slides featuring various data visualizations, including charts and graphs with different colored layout designs.
    Add to Wishlist
    Download
    AI Customize
    Data driven slide featuring a colorful chart with percentage values, showing a timeline from 4m to 6m with placeholder text.
    Add to Wishlist
    Download
    AI Customize
    Data driven slide displaying five key areas on a colorful circle with icons and text description.
    Free
    Add to Wishlist
    Download
    AI Customize
    Preventive maintenance illustration featuring yellow peaks with icons and labels for different stages.
    Add to Wishlist
    Download
    AI Customize
    Four step process for data driven marketing with color coded text boxes and description.
    Free
    Add to Wishlist
    Download
    AI Customize
    Bar chart with overlapping orange and peach shades depicting percentages for various categories on a white background.
    Add to Wishlist
    Download
    AI Customize
    Diagram showing percentages for date driven financing, marketing, teamwork, and scheduling, with icons and a radar chart.
    Free
    Add to Wishlist
    Download
    AI Customize
    Drive presentation slide showing layered area chart with metrics from profit model to customer engagement on a purple theme.
    Free
    Add to Wishlist
    Download
    AI Customize
    Red gradient mountain peak shapes on a white layout, showing varied heights for percentage data analysis.
    Free
    Add to Wishlist
    Download
    AI Customize
    Drive business presentation slide with a yellow line graph displaying varying percentages for ten key business categories.
    Free
    Add to Wishlist
    Download
    AI Customize
    Drive presentation template with orange gradient bell curves representing data percentages, on a red footer section.
    Add to Wishlist
    Download
    AI Customize
    Data driven PowerPoint slide featuring a line graph with three data sets and colorful circular progress indicators below.
    Add to Wishlist
    Download
    AI Customize
    The Future Of Data Catalogs PPT and Google Slides Themes
    Add to Wishlist
    Download
    AI Customize
    A data driven slide featuring a bar graph with categories A, B, C, D, and E, displaying percentages across various scores.
    Add to Wishlist
    Download
    AI Customize
    Editable Data Driven Presentation Template With Charts