Data Driven PowerPoint Template Presentation & Google Slides

Concentric circular infographic with five clorful segments, each showing percentages with four numbered captions.
P.ID : 34693
    880 views
    101 Downloads
    Get Custom Slides by Experts
    Instantly Access Templates in PowerPoint

    Dynamic Template For Slides:


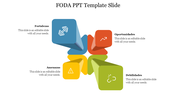
    Explore and download this circular diagram with semi-colored nodes to use in your presentation. The nodes hold a percentage of the related to the facts shared in the slides. The nodes are connected to the area where you can enter the facts. There are five nodes provided for you to insert as much information you want to them. The color used on the template is another eye-catchy aspect of this data-driven PowerPoint slide template. 

    The colors used on them are all editable ones which you can change according to your wish and theme. The data-driven PowerPoint slide presentation usually carries informative nodes inserted templates to make it more lively. This template will be apt for you to use in this kind of presentation.  

    Features of this Template:

    • 100% customizable slides and easy to download.
    • Slides available in different nodes & colors.
    • The Slide contained 16:9 and 4:3 format.
    • Easy to change the slide colors quickly.
    • Well-crafted Template with instant download facility.
    • Ready-made template.
    • Innovative template with colors.
    Advertisement

    You May Also Like These PowerPoint Templates

    Add to Wishlist
    Download
    AI Customize
    Data driven marketing slide illustrating a circular process with four steps harvest, analyze, activate, and optimize.
    Add to Wishlist
    Download
    AI Customize
    A colorful bar graph showing data driven insights with categories along with their corresponding percentages.
    Add to Wishlist
    Download
    AI Customize
    Data driven slides featuring various data visualizations, including charts and graphs with different colored layout designs.
    Add to Wishlist
    Download
    AI Customize
    Data driven slide featuring a colorful chart with percentage values, showing a timeline from 4m to 6m with placeholder text.
    Add to Wishlist
    Download
    AI Customize
    Data driven slide displaying five key areas on a colorful circle with icons and text description.
    Free
    Add to Wishlist
    Download
    AI Customize
    Preventive maintenance illustration featuring yellow peaks with icons and labels for different stages.
    Add to Wishlist
    Download
    AI Customize
    Four step process for data driven marketing with color coded text boxes and description.
    Free
    Add to Wishlist
    Download
    AI Customize
    Bar chart with overlapping orange and peach shades depicting percentages for various categories on a white background.
    Add to Wishlist
    Download
    AI Customize
    Diagram showing percentages for date driven financing, marketing, teamwork, and scheduling, with icons and a radar chart.
    Free
    Add to Wishlist
    Download
    AI Customize
    Drive presentation slide showing layered area chart with metrics from profit model to customer engagement on a purple theme.
    Free
    Add to Wishlist
    Download
    AI Customize
    Red gradient mountain peak shapes on a white layout, showing varied heights for percentage data analysis.
    Free
    Add to Wishlist
    Download
    AI Customize
    Drive business presentation slide with a yellow line graph displaying varying percentages for ten key business categories.
    Free
    Add to Wishlist
    Download
    AI Customize
    Drive presentation template with orange gradient bell curves representing data percentages, on a red footer section.
    Add to Wishlist
    Download
    AI Customize
    Data driven PowerPoint slide featuring a line graph with three data sets and colorful circular progress indicators below.
    Add to Wishlist
    Download
    AI Customize
    The Future Of Data Catalogs PPT and Google Slides Themes
    Add to Wishlist
    Download
    AI Customize
    A data driven slide featuring a bar graph with categories A, B, C, D, and E, displaying percentages across various scores.
    Add to Wishlist
    Download
    AI Customize
    Editable Data Driven Presentation Template With Charts