Awesome Data Driven PowerPoint And google Slides Template

Data driven slide displaying five key areas on a colorful circle with icons and text description.
P.ID : 34710
    753 views
    83 Downloads
    Get Custom Slides by Experts
    Instantly Access Templates in PowerPoint

    Data-Driven PowerPoint Presentation: Engaging Templates for Every Professional


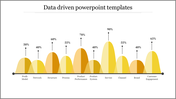
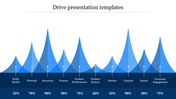
    Unlock the power of data with our captivating data driven PowerPoint templates designed to ignite your presentations! Dive into a world of creativity and functionality with our innovative slide designs, each meticulously crafted to elevate your storytelling experience. Our slides boast a vibrant, people-centric approach, featuring visually stunning multicolor double-shaded circles that effortlessly guide your audience through your message. Paired with dynamic hook designs and intuitive text areas arranged as a timeline, your presentations will leave a lasting impression on every viewer.

    Business professionals, students, and anyone seeking impactful presentations will find our templates indispensable. Simply plug in your data and let our templates do the rest, transforming complex information into compelling narratives. Whether you're pitching to clients, presenting research findings, or leading a classroom discussion, our templates empower you to communicate with clarity and confidence. Download now and embark on a journey of unparalleled storytelling prowess! Let your data shine, captivate your audience, and leave a lasting impact with our data-driven PowerPoint templates!

    Features of the template

    • 100% customizable slides and easy to download.
    • Slides are available in different colors
    • The slide has 4:3 and 16:9 formats.
    • Easy to change the slide colors quickly.
    • Appealing Presentation to impress an audience.
    • Create feature-rich slide presentations. 
    • An eye-pleasing color slide helps to give a catchy display.
    • It is apt with PPT and Google Slides.
    Advertisement

    You May Also Like These PowerPoint Templates

    Add to Wishlist
    Download
    AI Customize
    Data driven marketing slide illustrating a circular process with four steps harvest, analyze, activate, and optimize.
    Add to Wishlist
    Download
    AI Customize
    A colorful bar graph showing data driven insights with categories along with their corresponding percentages.
    Add to Wishlist
    Download
    AI Customize
    Data driven slides featuring various data visualizations, including charts and graphs with different colored layout designs.
    Add to Wishlist
    Download
    AI Customize
    Data driven slide featuring a colorful chart with percentage values, showing a timeline from 4m to 6m with placeholder text.
    Add to Wishlist
    Download
    AI Customize
    Data driven slide displaying five key areas on a colorful circle with icons and text description.
    Free
    Add to Wishlist
    Download
    AI Customize
    Preventive maintenance illustration featuring yellow peaks with icons and labels for different stages.
    Add to Wishlist
    Download
    AI Customize
    Four step process for data driven marketing with color coded text boxes and description.
    Free
    Add to Wishlist
    Download
    AI Customize
    Bar chart with overlapping orange and peach shades depicting percentages for various categories on a white background.
    Add to Wishlist
    Download
    AI Customize
    Diagram showing percentages for date driven financing, marketing, teamwork, and scheduling, with icons and a radar chart.
    Free
    Add to Wishlist
    Download
    AI Customize
    Drive presentation slide showing layered area chart with metrics from profit model to customer engagement on a purple theme.
    Free
    Add to Wishlist
    Download
    AI Customize
    Red gradient mountain peak shapes on a white layout, showing varied heights for percentage data analysis.
    Free
    Add to Wishlist
    Download
    AI Customize
    Drive business presentation slide with a yellow line graph displaying varying percentages for ten key business categories.
    Free
    Add to Wishlist
    Download
    AI Customize
    Drive presentation template with orange gradient bell curves representing data percentages, on a red footer section.
    Add to Wishlist
    Download
    AI Customize
    Data driven PowerPoint slide featuring a line graph with three data sets and colorful circular progress indicators below.
    Add to Wishlist
    Download
    AI Customize
    The Future Of Data Catalogs PPT and Google Slides Themes
    Add to Wishlist
    Download
    AI Customize
    A data driven slide featuring a bar graph with categories A, B, C, D, and E, displaying percentages across various scores.
    Add to Wishlist
    Download
    AI Customize
    Editable Data Driven Presentation Template With Charts