Data Driven PPT Presentation Template and Google Slides


Unleash Insights: Data-Driven PowerPoint Template
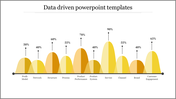
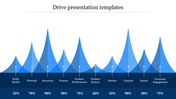
Empower your presentations with our Data Driven PowerPoint Presentation Template and Google Slides Themes, meticulously crafted to transform raw data into actionable insights. Visualize your data with a chart featuring five peaks, each representing a data point and accompanied by a percentage level, caption, and text area. Best for analysts, marketers, and decision-makers, these slides provide a dynamic platform to communicate complex data with clarity and impact. Whether in boardrooms, conferences, or virtual meetings, captivate your audience with visually engaging slides that drive understanding and facilitate decision-making. Seamlessly integrate your data and customize each element to fit your specific analysis requirements. With its user-friendly interface and customizable features, crafting data-driven presentations has never been easier. Elevate your insights and inspire action with our dynamic and visually compelling template.
Features of the template
- 100% customizable slides are easy to download.
- Slides are available in different colors.
- The slide has 4:3 and 16:9 formats.
- It is easy to change the slide colors quickly.
- It has a cute design to impress an audience.
- Create feature-rich, animated presentations.
- This slide is available in both PowerPoint and Google Slides.


You May Also Like These PowerPoint Templates
Add to Wishlist
Download
AI Customize

Add to Wishlist
Download
AI Customize

Add to Wishlist
Download
AI Customize

Add to Wishlist
Download
AI Customize

Add to Wishlist
Download
AI Customize

Add to Wishlist
Download
AI Customize

Add to Wishlist
Download
AI Customize

Add to Wishlist
Download
AI Customize


Add to Wishlist
Download
AI Customize


Add to Wishlist
Download
AI Customize


Add to Wishlist
Download
AI Customize

Add to Wishlist
Download
AI Customize

Add to Wishlist
Download
AI Customize

Add to Wishlist
Download
AI Customize
