Data Driven PowerPoint Presentation With Chart Design


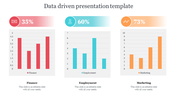


Data Driven Presentation Template
In today’s data-centric world, making informed decisions is more crucial than ever. Our Data Driven PowerPoint Presentation template is designed to help you present complex data clearly and compellingly, ensuring your audience grasps the key insights quickly and effectively.
Slide Description:
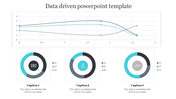
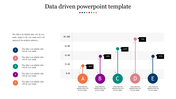
There are three bullet points, each accompanied by a small circle. The main visual element is a stylized bar chart with ten bars of varying heights, representing different values. Each bar has a label indicating its height in meters (e.g., “6.5m”). The background resembles rolling hills or mountains.
Purpose of this slide:
To visually represent quantitative information in an engaging and easily understandable way. It’s designed for data-driven presentations, where presenters need to convey complex data effectively.
Who can benefit?
Business professionals, educators, researchers, and anyone who presents data can benefit from this template. Whether you’re explaining sales figures, research findings, or performance metrics, this slide helps convey data.
Download now!
Features of the template:
- Slides are available in 4:3 & 16:9
- Get slides that are 100% customizable and easy to download
- Highly compatible with PowerPoint and Google Slides


You May Also Like These PowerPoint Templates

Add to Wishlist
Download
AI Customize

Add to Wishlist
Download
AI Customize


Add to Wishlist
Download
AI Customize

Add to Wishlist
Download
AI Customize

Add to Wishlist
Download
AI Customize

Add to Wishlist
Download
AI Customize

Add to Wishlist
Download
AI Customize

Add to Wishlist
Download
AI Customize

Add to Wishlist
Download
AI Customize

Add to Wishlist
Download
AI Customize


Add to Wishlist
Download
AI Customize


Add to Wishlist
Download
AI Customize


