Data Driven Marketing Strategy PPT And Google Slides

Five colored sections in green , orange, purple, yellow, and teal, showing different marketing strategies in a row.
P.ID : 70910
    294 views
    33 Downloads
    Get Custom Slides by Experts
    Instantly Access Templates in PowerPoint

    Data Driven Marketing Strategy Presentation Slides


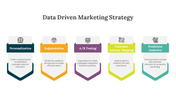
    Data-Driven Marketing Strategy is a pivotal approach in modern marketing, leveraging data to craft targeted and effective campaigns. It centers on the collection, analysis, and interpretation of customer data to refine marketing efforts, boost personalization, and maximize ROI. This strategy harnesses the power of insights to deliver tailored content, identify trends, and optimize customer journeys. Our Data-Driven Marketing Strategy template serves as an indispensable tool for marketers, analysts, and business leaders aiming to elucidate this concept. With fully editable slides and a professional design, it streamlines presentation creation, enabling you to effectively convey the significance of data-driven marketing. Whether you're training your team, presenting to stakeholders, or devising data-powered strategies, this template equips you to communicate the value of data in enhancing marketing outcomes, motivating your audience to embrace data-driven decision-making for marketing excellence.


    Features of the template:


    • 100% customizable slides and easy to download.
    • Slide are available in different nodes & colors.
    • The slide contains 16:9 and 4:3 formats.
    • Easy to change the colors of the slide quickly.
    • Highly compatible with PowerPoint and Google Slides.
    • Well-crafted template with an instant download facility.
    Advertisement

    You May Also Like These PowerPoint Templates

    Add to Wishlist
    Download
    AI Customize
    Data driven marketing slide illustrating a circular process with four steps harvest, analyze, activate, and optimize.
    Add to Wishlist
    Download
    AI Customize
    A colorful bar graph showing data driven insights with categories along with their corresponding percentages.
    Add to Wishlist
    Download
    AI Customize
    Data driven slides featuring various data visualizations, including charts and graphs with different colored layout designs.
    Add to Wishlist
    Download
    AI Customize
    Data driven slide featuring a colorful chart with percentage values, showing a timeline from 4m to 6m with placeholder text.
    Add to Wishlist
    Download
    AI Customize
    Data driven slide displaying five key areas on a colorful circle with icons and text description.
    Free
    Add to Wishlist
    Download
    AI Customize
    Preventive maintenance illustration featuring yellow peaks with icons and labels for different stages.
    Add to Wishlist
    Download
    AI Customize
    Four step process for data driven marketing with color coded text boxes and description.
    Free
    Add to Wishlist
    Download
    AI Customize
    Bar chart with overlapping orange and peach shades depicting percentages for various categories on a white background.
    Add to Wishlist
    Download
    AI Customize
    Diagram showing percentages for date driven financing, marketing, teamwork, and scheduling, with icons and a radar chart.
    Free
    Add to Wishlist
    Download
    AI Customize
    Drive presentation slide showing layered area chart with metrics from profit model to customer engagement on a purple theme.
    Free
    Add to Wishlist
    Download
    AI Customize
    Red gradient mountain peak shapes on a white layout, showing varied heights for percentage data analysis.
    Free
    Add to Wishlist
    Download
    AI Customize
    Drive business presentation slide with a yellow line graph displaying varying percentages for ten key business categories.
    Free
    Add to Wishlist
    Download
    AI Customize
    Drive presentation template with orange gradient bell curves representing data percentages, on a red footer section.
    Add to Wishlist
    Download
    AI Customize
    Data driven PowerPoint slide featuring a line graph with three data sets and colorful circular progress indicators below.
    Add to Wishlist
    Download
    AI Customize
    The Future Of Data Catalogs PPT and Google Slides Themes
    Add to Wishlist
    Download
    AI Customize
    A data driven slide featuring a bar graph with categories A, B, C, D, and E, displaying percentages across various scores.
    Add to Wishlist
    Download
    AI Customize
    Editable Data Driven Presentation Template With Charts