Creative Big Data Analytics PPT template For Presentation

Infographic showing a magnifying glass surrounded by three red data analytics icons and captions areas.
P.ID : 25798
    12 slides
    A collection of business data analysis PPT slides with colorful charts and infographics with icons on a white backdrop.
    16 slides
    Data cleansing cycle PowerPoint slides with different colorful layout designs with icons and text descriptions.
    13 slides
    Data analysis PowerPoint featuring an illustration of data charts and various slides layouts for analysis steps.
    13 slides
    Informative slides about data science, highlighting colorful different layout designs and icons.
    119 views
    5 Downloads
    Get Custom Slides by Experts
    Instantly Access Templates in PowerPoint

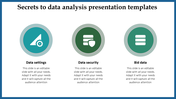
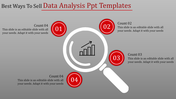
    Three Noded Data Analytics Slide With Magnifier

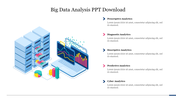
    Do you know what data analytics is? Yes, it refers to the process of analyzing datasets to make conclusions about the information they possess. It will enable businesses to optimize their performances. Get ready to analyze and present your data perfectly with our Data Analytics PPT Template. Get this editable slide now from SlideEgg to extract the data and make informed decisions for your business. The magnifier added in this slide represents the analysis and includes three text blocks with business icons to show your findings. 

    Features of the template

    • 100% customizable slides and easy to download.
    • Slides are available in different nodes & colors.
    • The slide contains 16:9 and 4:3 formats.
    • Easy to change the colors of the slide quickly.
    • Well-crafted template with instant download facility.
    • Creative slide with cool graphical elements.
    Advertisement

    You May Also Like These PowerPoint Templates

    Add to Wishlist
    Download
    AI Customize
    Circular data science application slide with ten numbered colorful boxes, arranged in a ring around a central title.
    Free
    Add to Wishlist
    Download
    AI Customize
    Colorful circular layout with grey central circle with icon, surrounding seven nodes, illustrating data cleansing steps.
    Free
    Add to Wishlist
    Download
    AI Customize
    Visual representation of data classification, featuring a laptop and labeled categories on a purple background.
    Add to Wishlist
    Download
    AI Customize
    Horizontal bar chart displaying data for five months and six regions, with four labeled icons in blue, purple, red, and teal.
    Add to Wishlist
    Download
    AI Customize
    Data analytics slide featuring laptops, tablets, charts, and graphs, with four options and icons listed below.
    Add to Wishlist
    Download
    AI Customize
    Hexagonal Flowchart of data science applications in social media, highlighting from recommendation engine upto optimization.
    Add to Wishlist
    Download
    AI Customize
    A 3D smartphone graphic showing data lines and charts, with white text on the left, set against a blue backdrop.
    Add to Wishlist
    Download
    AI Customize
    Support model diagram with six colorful triangles with icons showing data driven, cost efficient, and flexible strategies.
    Add to Wishlist
    Download
    AI Customize
    Pack of slide showcasing data collection methods with icons in different colors on a white backdrop.
    Add to Wishlist
    Download
    AI Customize
    Data science benefits visualized in a four step process with numbered colorful tabs in pink, green, orange, and blue.
    Add to Wishlist
    Download
    AI Customize
    Collection of data analytics icons, including charts, browser windows, magnifying glasses, and statistical graphs.
    Add to Wishlist
    Download
    AI Customize
    Editable Data Mining Essentials PPT And Google Slides
    Add to Wishlist
    Download
    AI Customize
    Two rounded rectangles in teal and red with icons and text, arranged side by side, on a white background.
    Add to Wishlist
    Download
    AI Customize
    A pack of qualitative research method slides showcasing various colorful layout designs and icons.
    Add to Wishlist
    Download
    AI Customize
    Data analytics slide with six labeled captions, each featuring a colored status indicator in green, orange, or red.