Enriching Data Analytics PPT Template Designs 6-Node


Data Insights with Visually Striking Data Analytics Presentations
Data is the lifeblood of any successful organization. It holds the key to unlocking valuable insights, identifying trends, and making informed decisions. But presenting this data effectively can be a challenge.
Introducing the Data Analytics PowerPoint Template and Google Slides Themes, your one-stop solution for crafting clear, compelling, and visually engaging data presentations.
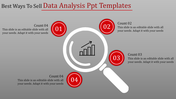
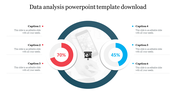
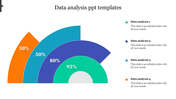
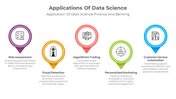
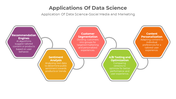
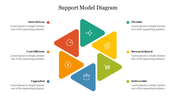
This unique template features a segmented circle design with six customizable nodes. Each node acts as a data point, equipped with a caption, title holder, and dedicated text area to showcase your findings.
Ideal for marketers, analysts, and business professionals, this template empowers you to:
- Simplify complex data and enhance audience understanding.
- Showcase trends and patterns with impactful visuals.
- Deliver data-driven narratives that resonate with your audience.
Stop settling for mediocre data presentations. Download the Data Analytics PowerPoint Template and Google Slides Themes today and transform your data insights into impactful presentations that get results.
Features of the Template
- 100 % customizable slides.
- The slide show is in 4:3, 16:9, zip format.
- There is powerful connectivity with Google Slides and PowerPoint.
- It is simple and quick to alter the slide's color.
- An efficient template that can be easily accessed immediately.
- Well-crafted template with an instant download facility.


You May Also Like These PowerPoint Templates
Add to Wishlist
Download
AI Customize

Add to Wishlist
Download
AI Customize

Add to Wishlist
Download
AI Customize
Add to Wishlist
Download
AI Customize

Add to Wishlist
Download
AI Customize

Add to Wishlist
Download
AI Customize

Add to Wishlist
Download
AI Customize

Add to Wishlist
Download
AI Customize

Add to Wishlist
Download
AI Customize

Add to Wishlist
Download
AI Customize

Add to Wishlist
Download
AI Customize

Add to Wishlist
Download
AI Customize

Add to Wishlist
Download
AI Customize

Add to Wishlist
Download
AI Customize

Add to Wishlist
Download
AI Customize

Add to Wishlist
Download
AI Customize

Add to Wishlist
Download
AI Customize

Add to Wishlist
Download
AI Customize

Add to Wishlist
Download
AI Customize

Add to Wishlist
Download
AI Customize
