Glorious Data Analytics PPT Template Slide Design-2 Node

Central magnifying glass displaying a red graph, paired with two icons representing data analytics.
P.ID : 25780
    11 slides
    Slide pack showing vibrant segments with colorful process diagrams, representing elements of mixed methods research.
    11 slides
    A data science slide with four colorful arrows labeled, from one to four each containing text and small descriptive icons.
    16 slides
    Collection of slides detailing data analysis techniques, with colorful numbered blocks and varied infographic designs.
    11 slides
    Data quality management slides with different colorful layout designs and text descriptions.
    108 views
    3 Downloads
    Get Custom Slides by Experts
    Instantly Access Templates in PowerPoint

    Showcase Insights with Glorious Data Analytics Template


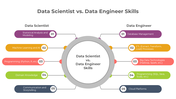
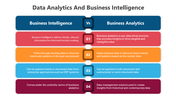
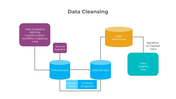
    Hey there! Ready to make your data presentations unforgettable? Our Glorious Data Analytics PPT Template Slide Design-2 Node is your go-to choice. With a striking red color theme and a sharp search icon, this template adds a touch of brilliance to your business slides. The two nodes provide a clear and concise way to present your analytics, ensuring your audience grasps key insights effortlessly. Perfect for showcasing data trends, performance metrics, or market analysis, this template is both visually captivating and easy to use. Fully customizable, it allows you to tweak each slide to perfectly fit your presentation needs. Impress your audience and make data storytelling a breeze with our Glorious Data Analytics PPT Template. 


    Features of this template:


    • 100% customizable slides and easy to download.
    • Slides available in different nodes & colors.
    • The slide contained 16:9 and 4:3 format.
    • Easy to change the slide colors quickly.
    • Well-crafted template with instant download facility.
    Advertisement

    You May Also Like These PowerPoint Templates

    Add to Wishlist
    Download
    AI Customize
    Slide featuring data science, data mining, and data analysis steps with placeholder text.
    Add to Wishlist
    Download
    AI Customize
    3D data visualization with charts on a tablet and two hexagonal stats, displayed on a dark blue background.
    Add to Wishlist
    Download
    AI Customize
    Visual representation of business benefits from data science, including improved efficiency and competitive advantage.
    Add to Wishlist
    Download
    AI Customize
    Data analytics slide with a layered silhouette of a running person, numbered sections, and icons for each step.
    Add to Wishlist
    Download
    AI Customize
    Big data analytics slide deck with colorful charts, showcasing types, benefits, and decision making aids.
    Add to Wishlist
    Download
    AI Customize
    Best Data Analysis PPT Slide Presentation
    Add to Wishlist
    Download
    AI Customize
    Slide featuring eight sections, each with a colored icons and text boxes arranged in two columns.
    Add to Wishlist
    Download
    AI Customize
    Three colored rectangles in orange, green, and teal, representing types of data stewards with text areas below.
    Add to Wishlist
    Download
    AI Customize
    Data analytics slide displaying a circular diagram with sections from data backup to data quality with colored icons.
    Add to Wishlist
    Download
    AI Customize
    Central magnifying glass with surrounding icons representing different data analytics elements.
    Add to Wishlist
    Download
    AI Customize
    Environmental data slide with a bar chart displaying statistics for humans, trees, animals, and water with placeholder text.
    Free
    Add to Wishlist
    Download
    AI Customize
    Data analysis slide with a business figure illustration and bar chart, featuring four colorful captions on a dark backdrop.
    Add to Wishlist
    Download
    AI Customize
    Slides featuring an overview of data aggregation processes with numbered steps in different colorful layout designs.
    Free
    Add to Wishlist
    Download
    AI Customize
    Six hexagons in different colors encircling a central data icon, each labeled with numbers and captions.
    Add to Wishlist
    Download
    AI Customize
    A PowerPoint template outlining the responsibilities of a data scientist, featuring four key tasks in a diamond layout.
    Add to Wishlist
    Download
    AI Customize
    Three bar charts in red, blue, and green, with captions and text below each for data analysis insights.