Best Data Analysis For Business PPT And Google Slides

Circular diagram with six colored segments around a central circle, illustrating the steps of data analysis.
P.ID : 69540
    16 slides
    Editable Data Cleansing PPT And Google Slides Templates
    13 slides
    Data Analysis PowerPoint Presentation and Google Slides
    13 slides
    Innovative Data Science PPT and Google Slides Templates
    202 views
    31 Downloads
    Get Custom Slides by Experts
    Instantly Access Templates in PowerPoint

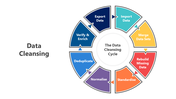
    Multicolor Data Analysis Presentation

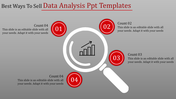
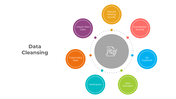
    Expressions involving data analysis work well with this PPT template. The central, large white circle depicts the overall finding or solution, while the six patterned circles stand in for the various data points or sorts. It is aesthetically cute and simple to learn because of the use of vivid colors and strong shapes. Due to its ability to simplify complex facts into more legible images, this template can be used to successfully present data analysis results to stakeholders.It is easy to edit and agree with PowerPoint and Google Slides. With this template, you can begin writing your own professional data analysis report. Grab it now!

    Features of the Template

    • 100% customizable slides and easy to download.
    • Slides are available in different colors
    • The slide has 4:3 and 16:9 formats.
    • Easy to change the slide colors quickly.
    • Appealing Presentation to impress an audience.
    • Create feature-rich slide presentations. 
    • An eye-pleasing color slide helps to give a catchy display.
    • Multicolor hue circle template.
    Advertisement

    You May Also Like These PowerPoint Templates

    Add to Wishlist
    Download
    AI Customize
    Effective Data Analytics Presentation PPT Template
    Add to Wishlist
    Download
    AI Customize
    Data analytics slide featuring laptops, tablets, charts, and graphs, with four options and icons listed below.
    Add to Wishlist
    Download
    AI Customize
    Hexagonal Flowchart of data science applications in social media, highlighting from recommendation engine upto optimization.
    Add to Wishlist
    Download
    AI Customize
    A 3D smartphone graphic showing data lines and charts, with white text on the left, set against a blue backdrop.
    Add to Wishlist
    Download
    AI Customize
    Support model diagram with six colorful triangles with icons showing data driven, cost efficient, and flexible strategies.
    Add to Wishlist
    Download
    AI Customize
    Pack of slide showcasing data collection methods with icons in different colors on a white backdrop.
    Add to Wishlist
    Download
    AI Customize
    Benefits And Uses Of Data Science PPT And Google Slides
    Add to Wishlist
    Download
    AI Customize
    Collection of data analytics icons, including charts, browser windows, magnifying glasses, and statistical graphs.
    Add to Wishlist
    Download
    AI Customize
    Editable Data Mining Essentials PPT And Google Slides
    Add to Wishlist
    Download
    AI Customize
    Qualitative Research Methods PPT And Google Slides Themes
    Add to Wishlist
    Download
    AI Customize
    Data Analytics PowerPoint Presentation Templates
    Add to Wishlist
    Download
    AI Customize
    Best Data Cleansing Strategy PowerPoint And Google Slides
    Add to Wishlist
    Download
    AI Customize
    A data science slide with four colorful arrows labeled, from one to four each containing text and small descriptive icons.