Editable Dashboard Template and Google Slides Themes

 Canva
Canva
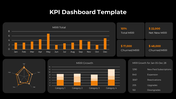

Streamline Your Data Visualization with Our Dashboard Template
Looking for a versatile tool to enhance your data presentations? Our Dashboard Template and Google Slides Themes offer a comprehensive solution.
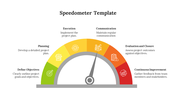
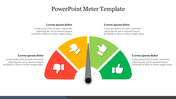
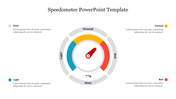
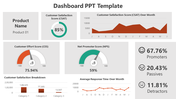
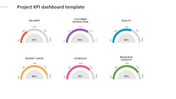
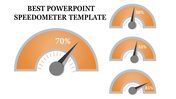
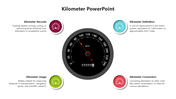
This template features three analog meters, each accompanied by a caption and a text area. With its multicolor options and dark background, it provides a sleek and professional look suitable for various industries.
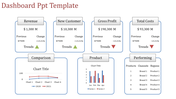
Who can benefit from this template? Business analysts, project managers, and data experts seeking to create impactful dashboards for monitoring key performance indicators (KPIs), tracking project progress, and presenting data-driven insights. Our template allows you to present complex data in an easy-to-understand format.
Features of the template
- 100% customizable slides are easy to download.
- Slides are available in different colors.
- The slide has 4:3 and 16:9 formats.
- It is easy to change the slide colors quickly.
- It has a cute design to impress an audience.
- Create feature-rich, animated presentations.


You May Also Like These PowerPoint Templates
Add to Wishlist
Download
AI Customize

Add to Wishlist
Download
AI Customize

Add to Wishlist
Download
AI Customize

Add to Wishlist
Download
AI Customize

Add to Wishlist
Download
AI Customize

Add to Wishlist
Download
AI Customize

Add to Wishlist
Download
AI Customize

Add to Wishlist
Download
AI Customize

Add to Wishlist
Download
AI Customize

Add to Wishlist
Download
AI Customize

Add to Wishlist
Download
AI Customize

Add to Wishlist
Download
AI Customize

Add to Wishlist
Download
AI Customize

Add to Wishlist
Download
AI Customize

Add to Wishlist
Download
AI Customize

Add to Wishlist
Download
AI Customize

Add to Wishlist
Download
AI Customize

Add to Wishlist
Download
AI Customize

Add to Wishlist
Download
AI Customize

Add to Wishlist
Download
AI Customize
