Best Dashboard Sales Performance Reports Revenue Charts

Best Dashboard Sales Performance Reports Revenue Charts
P.ID : 41687
    297 views
    45 Downloads
    Get Custom Slides by Experts
    Instantly Access Templates in PowerPoint

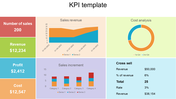
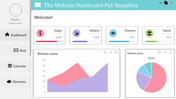
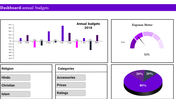
    Elegant Dashboard Slide For Your Needs

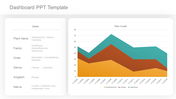
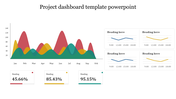
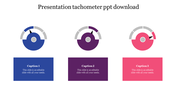
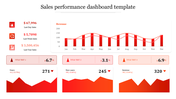
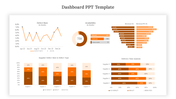
    Look for a tool to present your sales performance report. What could be a more effective tool than our creative dashboard PowerPoint template? It is the perfect layout designed with creative bars, charts, graphics, and blocks to represent your data in the best way. You can grab our slide to depict the data regarding sales, performance, reports, revenue, and so on. It is an ideal tool to make your work effective and informative. Buy it and edit it according to your needs.

    Features of the template

    • 100% customizable slides and easy to download.
    • Slides are available in different nodes & colors.
    • The slide contained 16:9 and 4:3 formats.
    • Easy to change the slide colors quickly.
    • It is a well-crafted template with an instant download facility.
    • It is a 100% pre-designed slide.
    • The slide is designed with bars and charts.
    Advertisement

    You May Also Like These PowerPoint Templates

    Add to Wishlist
    Download
    AI Customize
    KPI slide with four semi circular gauges displaying metrics and overlapping colored circles showing numerical data.
    Add to Wishlist
    Download
    AI Customize
    KPI dashboard layout with bar charts, a gauge, captions, and target metrics on light gray background, organized in sections.
    Add to Wishlist
    Download
    AI Customize
    Concentric pentagons in black with text areas around each corner, forming a simple monochrome layout.
    Add to Wishlist
    Download
    AI Customize
    Horizontal infographic with four tachometer icons in gradient colors, labeled with captions for each gauge.
    Add to Wishlist
    Download
    AI Customize
    Slide featuring a tachometer dial with four performance levels and linked captions in red, yellow, maroon, and blue.
    Add to Wishlist
    Download
    AI Customize
    Dashboard layout with charts in orange tones, including a donut chart, bar graphs, and a line chart for monthly data.
    Add to Wishlist
    Download
    AI Customize
    Slide with four red speedometers, each indicating a different percentage level, against a white background.
    Add to Wishlist
    Download
    AI Customize
    Cash flow dashboard with a vertical bar chart and two horizontal stacked bar charts detailing revenue categories.
    Add to Wishlist
    Download
    AI Customize
    Blue themed dashboard layout with a line chart, two growth metrics, and three semi circle gauges for budget.
    Add to Wishlist
    Download
    AI Customize
    Three circular dashboard dials with red, blue, and brown segments, each containing captions below.
    Add to Wishlist
    Download
    AI Customize
    Slide featuring a dashboard with three dials labeled Low, Mid, and High, indicating various levels of measurement.
    Free
    Add to Wishlist
    Download
    AI Customize
    Circular speedometer with orange and gray segments, displaying kilometer markings from 5.5 KM to 8 KM.
    Free
    Add to Wishlist
    Download
    AI Customize
    Dashboard graphic featuring a circular speedometer with a red needle, surrounded by text labels for various business metrics.
    Add to Wishlist
    Download
    AI Customize
    Speedometer slide with three colorful gauges showing percentages each with captions.