Dashboard PPT And Google Slides Designs

Dashboard presentation slide showing a plant growth chart from 2011 to 2018 with three plants and their growth percentages.
P.ID : 34850
    152 views
    3 Downloads
    Get Custom Slides by Experts
    Instantly Access Templates in PowerPoint

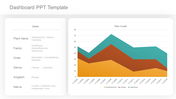
    Dashboard PPT Template


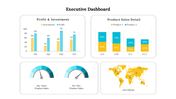
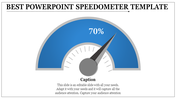
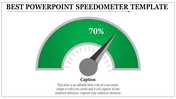
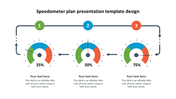
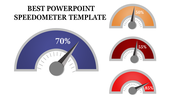
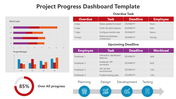
    Improve the position of your business, by introducing the Dashboard Presentation PPT And Google Slides. It helps to visualize your data insights effectively. The slide has a graph with varying curves. It comes with scale values and labeled axes providing a detailed view of your data trends. Below the graph, varying percentage values are displayed to highlight key metrics and performance indicators. Captions are included to offer additional context and enhance the presentation's comprehensibility. 

    Ideal for data analysts, business executives, project managers and marketing professionals. Helpful for performance reviews, strategic planning sessions and client presentations. A suitable template for critical insights, decision-making and communication. Download and explore!

    Features of the template

    • The slide contains 16:9 and 4:3 formats.
    • Compatible with Google slide themes and PowerPoint.
    • 100% customizable slides and free to download.
    • It is easy to change the colors of the slide quickly.
    • Well-crafted template with an instant download facility.
    Advertisement

    You May Also Like These PowerPoint Templates

    Add to Wishlist
    Download
    AI Customize
    Dashboard graphics displaying vehicle speeds with a data table listing vehicles, brands, and status.
    Free
    Add to Wishlist
    Download
    AI Customize
    Four vertical pointed icons in red, blue, purple, and orange, each aligned with caption on a light background.
    Add to Wishlist
    Download
    AI Customize
    Project dashboard slides with Gantt chart, a burndown chart, and a timeline, using a palette of brown, green, and red.
    Add to Wishlist
    Download
    AI Customize
    Tachometer PowerPoint slide with gauges indicating 10, 20, and 30 with captions for each.
    Add to Wishlist
    Download
    AI Customize
    Concentric pentagons in black with text areas around each corner, forming a simple monochrome layout.
    Add to Wishlist
    Download
    AI Customize
    Horizontal infographic with four tachometer icons in gradient colors, labeled with captions for each gauge.
    Add to Wishlist
    Download
    AI Customize
    Slide featuring a tachometer dial with four performance levels and linked captions in red, yellow, maroon, and blue.
    Add to Wishlist
    Download
    AI Customize
    Dashboard layout with charts in orange tones, including a donut chart, bar graphs, and a line chart for monthly data.
    Add to Wishlist
    Download
    AI Customize
    Slide with four red speedometers, each indicating a different percentage level, against a white background.
    Add to Wishlist
    Download
    AI Customize
    Blue themed dashboard layout with a line chart, two growth metrics, and three semi circle gauges for budget.
    Free
    Add to Wishlist
    Download
    AI Customize
    Circular speedometer with orange and gray segments, displaying kilometer markings from 5.5 KM to 8 KM.
    Free
    Add to Wishlist
    Download
    AI Customize
    Dashboard graphic featuring a circular speedometer with a red needle, surrounded by text labels for various business metrics.
    Add to Wishlist
    Download
    AI Customize
    Speedometer slide with three colorful gauges showing percentages each with captions.
    Add to Wishlist
    Download
    AI Customize
    Dashboard with a red line graph for Jan-May and a bar chart of four colored percentage bars and category icons.
    Add to Wishlist
    Download
    AI Customize
    Key performance indicator slide displaying data bars, percentages, and distinct icons in a structured layout.