Editable Stunning Dashboard Presentation Template Designs

 Canva
Canva
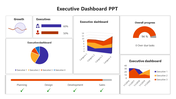

Dashboard Presentation Template
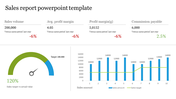
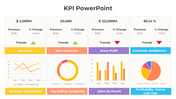
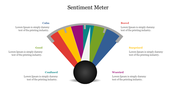
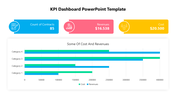
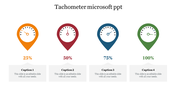
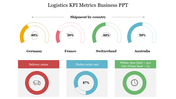
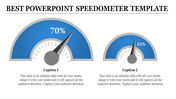
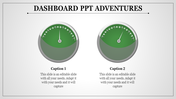
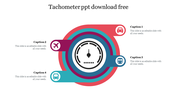
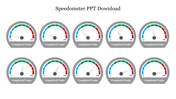
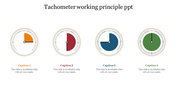
Looking for a slide to present your business analysis? Our PowerPoint template helps you present a clear format. The slide has a simple white background with three sets of metrics. The metrics are provided in the form of readings. Below the readings are the simple captions.Following the captions are the brief description.
This slide is a must-have for analysts, executives and data enthusiasts to convey complex information with simplicity. Perfect for transforming raw data into actionable insights. The slide is ideal for boardroom presentations and project updates. Download now to let your data speak volumes.
Features of the template
- 100% customizable slides and easy to download.
- Slides are available in different nodes & colors.
- The slide contains 16:9 and 4:3 formats.
- It is easy to change the colors of the slide quickly.
- Well-crafted template with an instant download facility.


You May Also Like These PowerPoint Templates
Add to Wishlist
Download
AI Customize

Add to Wishlist
Download
AI Customize

Add to Wishlist
Download
AI Customize

Add to Wishlist
Download
AI Customize

Add to Wishlist
Download
AI Customize

Add to Wishlist
Download
AI Customize

Add to Wishlist
Download
AI Customize


Add to Wishlist
Download
AI Customize

Add to Wishlist
Download
AI Customize

Add to Wishlist
Download
AI Customize

Add to Wishlist
Download
AI Customize

Add to Wishlist
Download
AI Customize

Add to Wishlist
Download
AI Customize

Add to Wishlist
Download
AI Customize

Add to Wishlist
Download
AI Customize

Add to Wishlist
Download
AI Customize

Add to Wishlist
Download
AI Customize

Add to Wishlist
Download
AI Customize

Add to Wishlist
Download
AI Customize
