Find our Collection of Dashboard Presentation Template

Dashboard slide with six gauge meters displaying low to high ranges, each labeled with captions below.
P.ID : 17490
    1.5K+ views
    182 Downloads
    Get Custom Slides by Experts
    Instantly Access Templates in PowerPoint

    Creative Dashboard Presentation Template


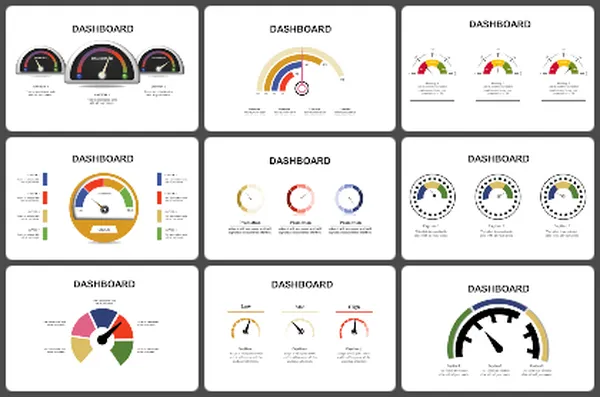
    In the busy business world, data isn't just numbers; it's a story waiting to be shared. Our Dashboard Presentation Template makes this transformation happen for you. Our template features six circular Dashboard meters, elegantly arranged against a clean white backdrop. Each meter is a blank canvas, ready for your data symphony. Whether it’s sales figures, More...
    Advertisement

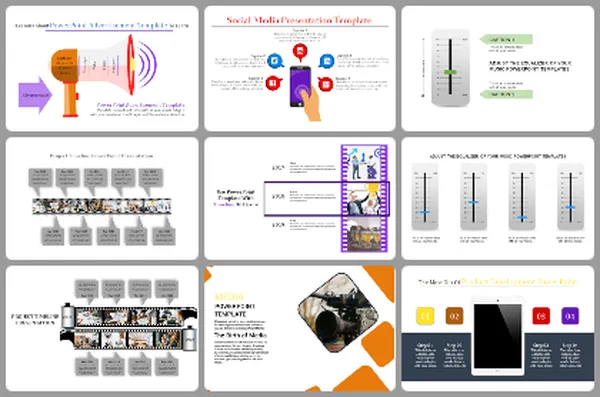
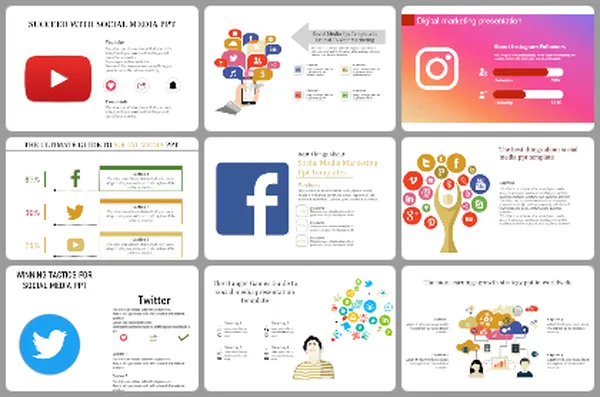
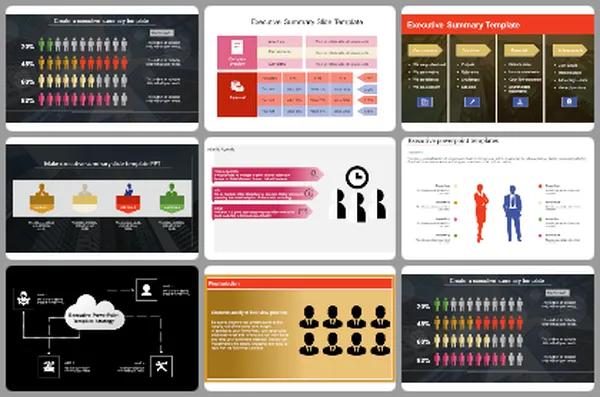
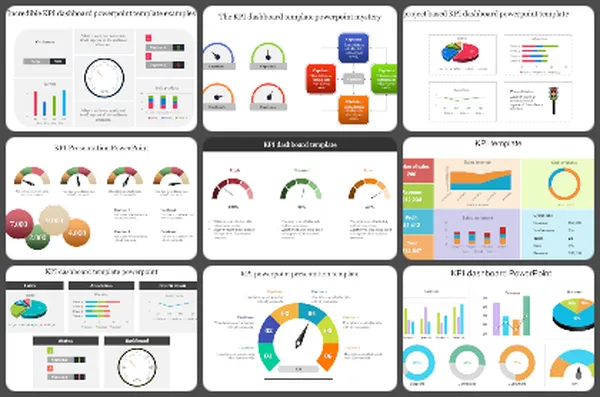
    You May Also Like These PowerPoint Templates

    Add to Wishlist
    Download
    AI Customize
    Dashboard template with a world map showing highlighted regions, bar graphs, and financial data captions.
    Add to Wishlist
    Download
    AI Customize
    Green themed dashboard template with three plant growth in line, bar and area chart for different years and species.
    Add to Wishlist
    Download
    AI Customize
    Purple themed dashboard slide featuring multiple charts and a text box for descriptive content.
    Free
    Add to Wishlist
    Download
    AI Customize
    Circular speedometer infographic with a black needle, yellow progress arc, and distance markers, next to an text box.
    Add to Wishlist
    Download
    AI Customize
    Three colored tachometer gauges in red, orange, and green, each paired with a caption areas beneath.
    Add to Wishlist
    Download
    AI Customize
    Tachometer PowerPoint template with four stages featuring colorful gauges and caption areas on a white backdrop.
    Add to Wishlist
    Download
    AI Customize
    Project dashboard template with four speedometer charts representing different completion levels with placeholder text.
    Add to Wishlist
    Download
    AI Customize
    Dashboard slide with three blue icons and captions paired with a bar chart on a tablet screen, and a desk setup on the right.
    Add to Wishlist
    Download
    AI Customize
    Sales performance dashboard PowerPoint template with a line graph, pie chart, and percentage change analysis.
    Add to Wishlist
    Download
    AI Customize
    Executive dashboard slide displaying project details including start date, deadline, team members, and activities.
    Add to Wishlist
    Download
    AI Customize
    Dashboard template with two horizontal bar charts, a calendar icon, and circular progress indicators in orange and green.
    Add to Wishlist
    Download
    AI Customize
    Laptop screen displaying a blue bar chart, surrounded by business dashboard elements placed in dark background.
    Add to Wishlist
    Download
    AI Customize
    Yellow speedometer graphic indicating 70%, with a gray needle pointing right and a caption area below.
    Add to Wishlist
    Download
    AI Customize
    Chart design slide tracking article likes, comments, shares, total posts, and new subscriber growth with visual graphs.
    Add to Wishlist
    Download
    AI Customize
    Yellow speedometer design with two semicircular gauges displaying percentages, each paired with captions.
    Add to Wishlist
    Download
    AI Customize
    Dashboard slide showcasing a semi circular layout with five numbered segments in blue, red, and green, each with captions.
    Add to Wishlist
    Download
    AI Customize
    Infographic featuring two red semicircular speedometers with needles, displaying percentages, and captions below.
    Add to Wishlist
    Download
    AI Customize
    Black circular speedometer gauge with a green needle, surrounded by six captions on a white background.
    Add to Wishlist
    Download
    AI Customize
    Speedometer PowerPoint template with yellow background showing a 70 percent reading, along with 50 and 60 percent gauges.