Multicolor Dashboard PowerPoint Presentation Template

Dashboard template with a plant growth stacked bar chart, showing yearly data for Zantedeschia, Celosia, and Calendula.
P.ID : 35274
    124 views
    2 Downloads
    Get Custom Slides by Experts
    Instantly Access Templates in PowerPoint

    Dashboard Presentation Template


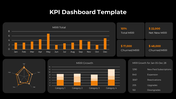
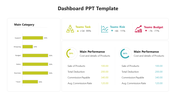
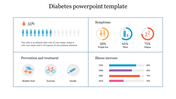
    Captivate your audience with our Dashboard PowerPoint template. The slide showcased in the image is meticulously designed, featuring a bar graph labeled “Plant Growth.” Here’s what you’ll find:

    Bar Graph: On the right side, a bar graph displays plant growth over different years (2012 - 2017) for three types of plants: Zantedeschia, Calathea, and Genebra.
    Customizable Elements: Every element on the slide is customizable, offering flexibility to tailor the content according to your specific needs.
    Professional Look: The elegant textured grey background gives it a polished and professional appearance.

    Who Can Benefit?

    U.S. professionals, students, or anyone tasked with presenting data will find this template invaluable. It’s not just about displaying numbers; it’s about telling a story that resonates with your audience. 

    Easy to Edit: Whether you’re a seasoned presenter or a beginner, this template is easy to edit and adapt.
    Clarity and Engagement: Use it to enhance clarity, keep engagement high, and convey authority.

    Explore our Dashboard Presentation Template now – where sophistication meets simplicity, and complexity transforms into clarity.

    Features of the template:

    •  Slides are available in 4:3 & 16:9
    • Well-crafted template with instant download.
    • Get slides that are 100% customizable and easy to download
    Advertisement

    You May Also Like These PowerPoint Templates

    Add to Wishlist
    Download
    AI Customize
    Dashboard slide with six gauge meters displaying low to high ranges, each labeled with captions below.
    Add to Wishlist
    Download
    AI Customize
    Circular tachometer design with a central gauge and surrounding colored segments, each linked to captions on the right.
    Add to Wishlist
    Download
    AI Customize
    KPI slide table with yearly financial data from FY16 to FY19 from operations to cash equivalents with placeholder text.
    Add to Wishlist
    Download
    AI Customize
    Speedometer template with a needle pointing at 70%, featuring a section in a whote backdrop for a caption areas.
    Add to Wishlist
    Download
    AI Customize
    Speedometer template with four gauges displaying percentages: blue at 70%, orange at 50%, dark red at 55%, and red at 85%.
    Add to Wishlist
    Download
    AI Customize
    Project dashboard with colorful bar charts, tables in red and purple, a circular gauge, and four blue phase icons below.
    Free
    Add to Wishlist
    Download
    AI Customize
     Row of colorful tachometers with different needle positions, each paired with a corresponding caption box.
    Add to Wishlist
    Download
    AI Customize
    Creative KPI Dashboard PPT And Google Slides Template
    Add to Wishlist
    Download
    AI Customize
    Executive dashboard slide displaying many charts from new business to operational expenses.
    Add to Wishlist
    Download
    AI Customize
    Dashboard template with a semi-circular gauge indicating performance with a blurred image and caption areas.
    Add to Wishlist
    Download
    AI Customize
    Dashboard slide showing plant growth data with details table and area chart for Zantedeschia, Celosia, and Calendula.
    Add to Wishlist
    Download
    AI Customize
    Colorful Tachometer slide with color coded sections from light to BMI with placeholder text.
    Add to Wishlist
    Download
    AI Customize
    Slide with three tachometer dials in blue, purple, and pink, each aligned above a matching caption box.
    Add to Wishlist
    Download
    AI Customize
    Dashboard graphics displaying vehicle speeds with a data table listing vehicles, brands, and status.
    Free
    Add to Wishlist
    Download
    AI Customize
    Four vertical pointed icons in red, blue, purple, and orange, each aligned with caption on a light background.
    Add to Wishlist
    Download
    AI Customize
    Project dashboard slides with Gantt chart, a burndown chart, and a timeline, using a palette of brown, green, and red.