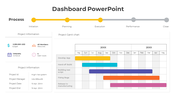
Multicolor Dashboard PowerPoint template and Google slides


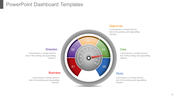
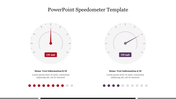

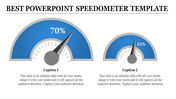
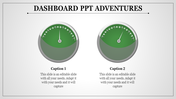

Speedometer Dashboard PPT template presentation
Struggling to present your data in a clear and engaging way? This dashboard PPT template is the answer! Imagine a colorful speedometer with five sections, ready to showcase your key metrics. Each section lets you add captions and text, making it easy to highlight important data points. No matter if you're a business professional tracking sales, a marketing team monitoring campaigns, or an educator following student progress, this template is perfect for anyone who needs to present data. It's user-friendly - simply add your information directly on the template. Plus, you can customize the colors, fonts, and even the number of sections to perfectly match your specific data. Download this template today and transform your complex data presentations into clear and informative dashboards that will grab attention and leave a lasting impression.
Features of the template
- 100% customizable slides and easy to download.
- The slides contain 16:9 and 4:3 formats.
- Easy to change the colors quickly.
- It is a well-crafted template with an instant download facility.
- It is a 100% pre-designed slide.
- The slide holds vibrant colors.


You May Also Like These PowerPoint Templates
Add to Wishlist
Download
AI Customize

Add to Wishlist
Download
AI Customize

Add to Wishlist
Download
AI Customize

Add to Wishlist
Download
AI Customize

Add to Wishlist
Download
AI Customize

Add to Wishlist
Download
AI Customize

Add to Wishlist
Download
AI Customize

Add to Wishlist
Download
AI Customize

Add to Wishlist
Download
AI Customize

Add to Wishlist
Download
AI Customize

Add to Wishlist
Download
AI Customize

Add to Wishlist
Download
AI Customize

Add to Wishlist
Download
AI Customize


Add to Wishlist
Download
AI Customize

Add to Wishlist
Download
AI Customize

Add to Wishlist
Download
AI Customize

Add to Wishlist
Download
AI Customize

Add to Wishlist
Download
AI Customize

Add to Wishlist
Download
AI Customize
