Creative Dashboard PPT Template Presentation

Speed performance slide with a stopwatch illustration at the center, and three icons with text on a gradient backdrop.
P.ID : 5442
    311 views
    7 Downloads
    Get Custom Slides by Experts
    Instantly Access Templates in PowerPoint

    Dashboard PPT Presentation Slide


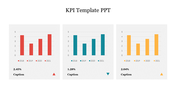
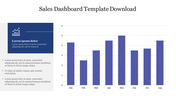
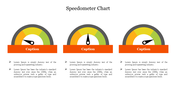
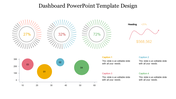
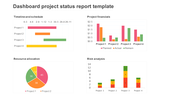
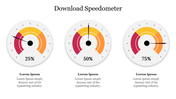
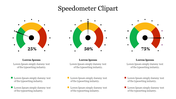
    Rev up your presentations with our dynamic Dashboard PowerPoint Template! Picture this: a sleek dashboard-themed design featuring three car icons alongside a speedometer-inspired stopwatch. It's not just another slide deck; it's a journey toward impactful communication. In the heart of this template lies a meticulously crafted dashboard layout, perfect for showcasing key metrics, KPIs, and progress indicators. Seamlessly integrate your data into this visually compelling interface, guiding your audience through the narrative with precision and clarity.

    Business professionals, students, entrepreneurs—anyone seeking to drive their message home with style and efficiency. Whether you're delivering quarterly reports, pitching a new idea, or presenting research findings, this template puts the pedal to the metal, ensuring your message accelerates towards success! Ready to turbocharge your presentations? Download our Dashboard PowerPoint Template today and experience the thrill of captivating your audience like never before! With its intuitive design and versatile functionality, it's time to revitalize your presentations and leave a lasting impression. Let's hit the road to presentation excellence together!

    Features of the template

    • 100% customizable slides and easy to download.
    • Slides are available in different colors
    • The slide has 4:3 and 16:9 formats.
    • Easy to change the slide colors quickly.
    • Appealing Presentation to impress an audience.
    • Create feature-rich slide presentations. 
    • An eye-pleasing color slide helps to give a catchy display.
    • Highly compatible with PowerPoint and Google Slides.
    Advertisement

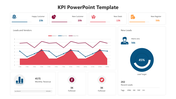
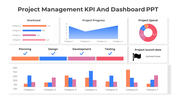
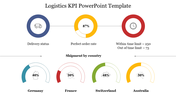
    You May Also Like These PowerPoint Templates

    Add to Wishlist
    Download
    AI Customize
    Project management dashboard with charts for budget, progress, risks, workload, and projected launch date and icons.
    Add to Wishlist
    Download
    AI Customize
    PowerPoint slide with KPI dashboard metrics, including revenue, sales by month, and customer revenue comparison.
    Free
    Add to Wishlist
    Download
    AI Customize
    KPI Dashboard with bubbles for sales, attendance, download, and report and a client location legend.
    Add to Wishlist
    Download
    AI Customize
    KPI Training slide featuring a social media analysis table with metrics for followers, mentions, interactions, and shares.
    Add to Wishlist
    Download
    AI Customize
    Task management dashboard slide showing task numbers and completion percentages with colored gauge icons.
    Add to Wishlist
    Download
    AI Customize
    Revenue dashboard with bar charts, statistics, and sliders showing data metrics in various colors.
    Add to Wishlist
    Download
    AI Customize
    Editable Speedometer PowerPoint Template Presentation
    Add to Wishlist
    Download
    AI Customize
    Color coded executive dashboard slide displaying a timeline of tasks, various sections, and charts.
    Add to Wishlist
    Download
    AI Customize
    Slide featuring a colorful tachometer diagram explaining its components, functionality, and usage with icons.
    Add to Wishlist
    Download
    AI Customize
    RAG dashboard with red, yellow, and green sections showing project status, using bar, line, and pie charts.
    Free
    Add to Wishlist
    Download
    AI Customize
    Automotive Dashboard PPT Presentation and Google Slides
    Add to Wishlist
    Download
    AI Customize
    Two circular charts show metrics in red and green, representing key performance indicators for warehouse operations.
    Add to Wishlist
    Download
    AI Customize
    Easily Editable Progress Dashboard Template
    Add to Wishlist
    Download
    AI Customize
    Circular dashboard graphic with five colored sections labeled surrounding a central gauge with a red needle.
    Add to Wishlist
    Download
    AI Customize
    Credit score meter with a needle in the center, displaying risk levels on a gradient from yellow to blue with caption areas.
    Free
    Add to Wishlist
    Download
    AI Customize
    Two speedometers with red and purple needle pointers, with caption and corresponding colored dots below.
    Add to Wishlist
    Download
    AI Customize
    3D sales chart displaying a 60 percent sales progress with an informative text section and interactive button on blue theme.
    Add to Wishlist
    Download
    AI Customize
    Dashboard template displaying a project timeline with a Gantt chart, project details, and phases from initiation to closure.