Editable Dashboard Google Slides And PowerPoint Template

Dashboard slide with performance indicators in circular charts and financial data blocks in orange, blue, and green sections.
P.ID : 4191
    261 views
    11 Downloads
    Get Custom Slides by Experts
    Instantly Access Templates in PowerPoint

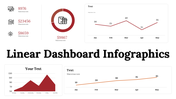
    Dashboard PowerPoint, Google Slides, and Canva Template


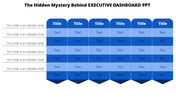
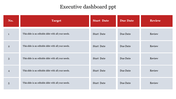
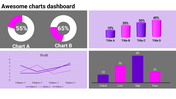
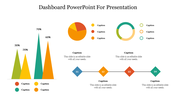
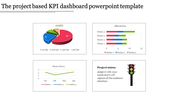
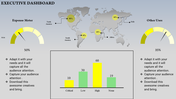
    A dashboard is the cornerstone of effective data visualization, offering an intuitive way to track, analyze, and present key metrics in real-time. Whether you're a business professional, student, or researcher, this multicolor, single-slide dashboard template is designed to make your data-driven insights stand out. Featuring unique infographics and easy-to-customize text, this slide ensures seamless communication of complex data.

    Purpose Of The Slides

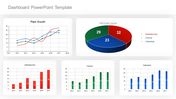
    This slide is meticulously crafted to help professionals and students consolidate and present critical data points in one visually engaging format. The dashboard slide enables users to showcase performance metrics, track KPIs, or present statistical trends effortlessly. Its multicolor theme ensures clarity, while the design promotes a logical flow of information.

    Who Can Use It?

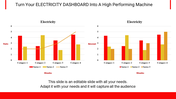
    Ideal for business analysts, marketers, data scientists, and educators, this dashboard template simplifies the process of data presentation. From corporate meetings to academic lectures, it caters to anyone who needs to translate raw data into meaningful narratives. Its user-friendly design also suits students preparing reports or projects requiring statistical insights.

    Special Key Features

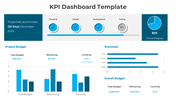
    Elevate your data presentation game with this dashboard slide. Its customizable features, vibrant colors, and intuitive layout allow you to communicate insights effectively and efficiently. Download this unique slide today to transform your metrics into a compelling visual story that resonates with your audience!


    Features of this template

    • 100% customizable slides and easy to download.
    • The slides contain 16:9 and 4:3 formats.
    • Easy to change the colors quickly.
    • Highly compatible with PowerPoint, Google Slides, and Canva templates.
    Advertisement

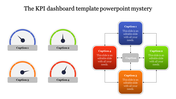
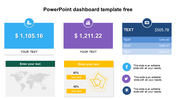
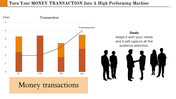
    You May Also Like These PowerPoint Templates

    Add to Wishlist
    Download
    AI Customize
    Dashboard slide showing business performance, including technology, accessibility, and security scores with activity graphs.
    Add to Wishlist
    Download
    AI Customize
    KPI dashboard slide featuring six charts vertical bars, horizontal bars, area graph, pie chart, and column bar graphs.
    Add to Wishlist
    Download
    AI Customize
    KPI dashboard highlighting supplier statistics using donut charts, order-to-invoice process, and bar charts.
    Free
    Add to Wishlist
    Download
    AI Customize
    Dashboard with four sections showing charts, icons, and metrics in purple, red, green, and teal.
    Free
    Add to Wishlist
    Download
    AI Customize
    A slide with a sleek dashboard design that includes colorful data visualizations like pie charts, graphs, and progress bars.
    Free
    Add to Wishlist
    Download
    AI Customize
    KPI dashboard with percentage stats, bar charts, and flow diagrams in red, blue, and orange representing data trends.
    Add to Wishlist
    Download
    AI Customize
    KPI dashboard slide displaying supplier metrics with colorful pie charts, bar graphs, and a process flow with percentages.
    Free
    Add to Wishlist
    Download
    AI Customize
    KPI slide displaying three circular meters with red, green, and orange sections, with text descriptions on the right.
    Add to Wishlist
    Download
    AI Customize
    Key Performance Indicators (KPI) scorecard template displaying various objectives in colored sections each with text area.
    Free
    Add to Wishlist
    Download
    AI Customize
    KPI PPT Template with three colourful circular progress charts  showing percentages, growth indicators, and  bar charts.
    Add to Wishlist
    Download
    AI Customize
    KPI dashboard slide showing multiple charts, including bar, line, pie, and gauge charts with tracking business data.
    Free
    Add to Wishlist
    Download
    AI Customize
    KPI Template PPT Presentation Slide With Bar Chart
    Add to Wishlist
    Download
    AI Customize
    Four semi circular charts showing shipment percentages by country, with icons below for delivery status and order rates.
    Add to Wishlist
    Download
    AI Customize
    KPI report slide displaying software sales, downloads, and attendance metrics with speedometer gauges and growth indicators.
    Add to Wishlist
    Download
    AI Customize
    Logistics KPI PowerPoint Template and Google Slides
    Add to Wishlist
    Download
    AI Customize
    Two circular charts show metrics in red and green, representing key performance indicators for warehouse operations.
    Add to Wishlist
    Download
    AI Customize
    KPI slide highlighting essential business metrics alongside color coded sections for quick reference and analysis.
    Add to Wishlist
    Download
    AI Customize
    Four colored semicircles for country data with percentages, and bottom section with three colorful circles for metrics.