Interactive Dashboard PPT Template for Business Metrics

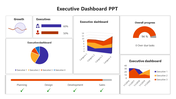
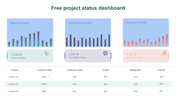
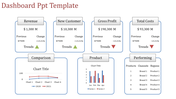

Purple Theme Dashboard PowerPoint Template
Dashboards are essential tools for consolidating data and key performance indicators (KPIs) into easily digestible formats, enabling quick insights and informed decision-making.
About the Dashboard
Dashboard PowerPoint template provide a comprehensive snapshot of important metrics through intuitive charts, graphs, and tables. They facilitate trend analysis, goal monitoring, and strategic planning.
Benefits
Presenters can effortlessly insert data, charts, and graphics to communicate insights effectively. The template ensures design consistency and delivers polished presentations that captivate audiences.
Who Can Use
This Dashboard template is ideal for business professionals looking to analyze performance metrics and trends, project managers needing to monitor project milestones and performance indicators, and educators seeking to visualize educational data and performance metrics effectively.
Get It Now!
Features of the template:
- 100% customizable slides and easy to download.
- The slides contain 16:9 and 4:3 formats.
- Easy to change the colors quickly.
- It is a 100% pre-designed slide.


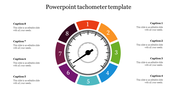
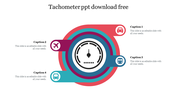
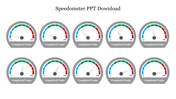
You May Also Like These PowerPoint Templates

Add to Wishlist
Download
AI Customize

Add to Wishlist
Download
AI Customize

Add to Wishlist
Download
AI Customize

Add to Wishlist
Download
AI Customize

Add to Wishlist
Download
AI Customize

Add to Wishlist
Download
AI Customize

Add to Wishlist
Download
AI Customize

Add to Wishlist
Download
AI Customize

Add to Wishlist
Download
AI Customize

Add to Wishlist
Download
AI Customize

Add to Wishlist
Download
AI Customize

Add to Wishlist
Download
AI Customize

Add to Wishlist
Download
AI Customize

Add to Wishlist
Download
AI Customize

Add to Wishlist
Download
AI Customize

Add to Wishlist
Download
AI Customize

Add to Wishlist
Download
AI Customize

Add to Wishlist
Download
AI Customize

Add to Wishlist
Download
AI Customize
