Advanced Dashboard PPT Template for Business Intelligence


Dashboard Presentation Template And Google Slides Themes
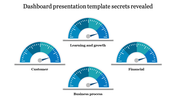
Effectively communicating data is crucial in today's data-driven world. Our Dashboard PPT - Google Slides Themes template empowers you to transform complex data into clear and compelling visuals.
Purpose of This Slide:
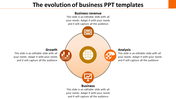
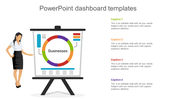
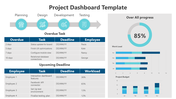
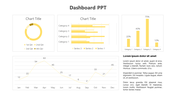
It features two distinct dashboard images with corresponding text boxes, this template allows you to showcase multiple data sets and key metrics side-by-side.
Who Can Use This Slide?
Business professionals, data analysts, educators, and students can utilize this template to present data-driven insights in a visually engaging and easy-to-understand manner.
Where It Can Be Used?
From business presentations and financial reports to academic research and project proposals, this template offers a versatile platform for data visualization across various fields.
Download this template and unlock the power of effective data storytelling!
Features of the template
- 100% customizable slides and easy to download.
- Slides are available in different nodes & colors.
- The slide contains 16:9 and 4:3 formats.
- It is easy to change the colors of the slide quickly.
- Well-crafted template with an instant download facility.


You May Also Like These PowerPoint Templates
Add to Wishlist
Download
AI Customize

Add to Wishlist
Download
AI Customize

Add to Wishlist
Download
AI Customize

Add to Wishlist
Download
AI Customize

Add to Wishlist
Download
AI Customize

Add to Wishlist
Download
AI Customize

Add to Wishlist
Download
AI Customize

Add to Wishlist
Download
AI Customize

Add to Wishlist
Download
AI Customize

Add to Wishlist
Download
AI Customize

Add to Wishlist
Download
AI Customize

Add to Wishlist
Download
AI Customize

Add to Wishlist
Download
AI Customize

Add to Wishlist
Download
AI Customize

Add to Wishlist
Download
AI Customize

Add to Wishlist
Download
AI Customize

Add to Wishlist
Download
AI Customize

Add to Wishlist
Download
AI Customize

Free
Add to Wishlist
Download
AI Customize

Add to Wishlist
Download
AI Customize
