Easy To Customize Dashboard PPT And Google Slides Template

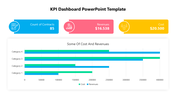
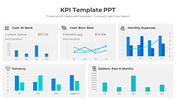

Dashboard PowerPoint Slide
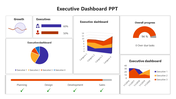
Transforming complex data into actionable insights has never been easier with the power of dashboards. Whether you're a business professional, educator, or researcher, dashboards offer a dynamic way to visualize and analyze information. Imagine having all your key metrics and KPIs displayed in one centralized location, allowing you to track performance, identify trends, and make informed decisions in real-time. With intuitive design and customizable features, dashboards provide a comprehensive overview of your data, empowering you to uncover valuable insights with ease. Our dashboard PowerPoint template offers a range of customizable slides designed to streamline data visualization. All slides are fully editable, allowing users to customize colors, fonts, and layouts to suit their specific needs. This template is perfect for professionals seeking to enhance the effectiveness of their data presentations, saving time and making it easier to convey information to stakeholders. Take your data presentations to the next level with our dashboard template. Download now and experience the power of streamlined data visualization in your presentations!
Features of this template
- 100% customizable slides and easy to download.
- Slides are available in different nodes & colors.
- The slide contains 16:9 and 4:3 formats.
- Easy to change the colors of the slide quickly.
- Highly compatible with PowerPoint and Google Slides.
- Well-crafted template with an instant download facility.


You May Also Like These PowerPoint Templates


Add to Wishlist
Download
AI Customize

Add to Wishlist
Download
AI Customize

Add to Wishlist
Download
AI Customize

Add to Wishlist
Download
AI Customize

Add to Wishlist
Download
AI Customize

Add to Wishlist
Download
AI Customize


Add to Wishlist
Download
AI Customize

Add to Wishlist
Download
AI Customize

Add to Wishlist
Download
AI Customize


Add to Wishlist
Download
AI Customize

Add to Wishlist
Download
AI Customize

Add to Wishlist
Download
AI Customize

Add to Wishlist
Download
AI Customize

Add to Wishlist
Download
AI Customize

Add to Wishlist
Download
AI Customize

Add to Wishlist
Download
AI Customize
