Fully Editable Dashboard PPT And Google Slides

Dashboard slide with three red speedometer gauges and captions, set against a white background.
P.ID : 17257
    119 views
    6 Downloads
    Get Custom Slides by Experts
    Instantly Access Templates in PowerPoint

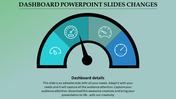
    Dashboard PPT Template


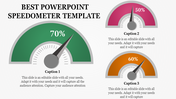
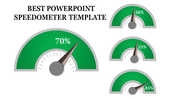
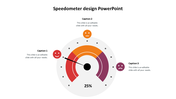
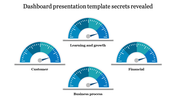
    Take your presentations to the level of clarity, by introducing our innovative PPT And Google Slides Dashboard Template. The slide comes with three sleek speedometers. Each of them represents different metrics or key performance indicators (KPIs). Ideal for business executives, project managers, analysts and consultants. 

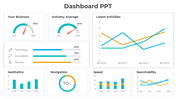
    Suitable for presenting financial metrics, project progress or sales performance. It helps to create compelling dashboards that attract audiences and drive actionable insights. Download now to bring more engagement to your presentation.

    Features of the template

    • The slide contains 16:9 and 4:3 formats.
    • Compatible with Google slide themes and PowerPoint.
    • 100% customizable slides and easy to download.
    • It is easy to change the colors of the slide quickly.
    • Well-crafted template with an instant download facility.
    Advertisement

    You May Also Like These PowerPoint Templates

    Add to Wishlist
    Download
    AI Customize
    Tachometer PPT slide with 4 colorful gauges in red, orange, green, and blue, each with caption sections on a white backdrop.
    Add to Wishlist
    Download
    AI Customize
    Dashboard PowerPoint slide featuring pie, bar, and line charts with placeholder text and data visualization.
    Free
    Add to Wishlist
    Download
    AI Customize
    Business slide featuring a circular layout with four orange sections and icons representing key aspects of business.
    Add to Wishlist
    Download
    AI Customize
    KPI dashboard slide with key metrics for business, development, and downloads, showing percentages with icons.
    Add to Wishlist
    Download
    AI Customize
    KPI slide displaying a financial table for FY 2018, with figures for Net Sales, Income, and Expenses for each quarter.
    Free
    Add to Wishlist
    Download
    AI Customize
    Free KPI PPT Template For Presentation & Google Slides
    Add to Wishlist
    Download
    AI Customize
    Key Performance Indicators (KPI) scorecard template displaying various objectives in colored sections each with text area.
    Free
    Add to Wishlist
    Download
    AI Customize
    KPI PPT Template with three colourful circular progress charts  showing percentages, growth indicators, and  bar charts.
    Add to Wishlist
    Download
    AI Customize
    KPI dashboard slide showing multiple charts, including bar, line, pie, and gauge charts with tracking business data.
    Free
    Add to Wishlist
    Download
    AI Customize
    KPI Template PPT Presentation Slide With Bar Chart
    Add to Wishlist
    Download
    AI Customize
    Four semi circular charts showing shipment percentages by country, with icons below for delivery status and order rates.
    Add to Wishlist
    Download
    AI Customize
    KPI report slide displaying software sales, downloads, and attendance metrics with speedometer gauges and growth indicators.
    Add to Wishlist
    Download
    AI Customize
    Logistics KPI PowerPoint Template and Google Slides
    Add to Wishlist
    Download
    AI Customize
    Two circular charts show metrics in red and green, representing key performance indicators for warehouse operations.
    Add to Wishlist
    Download
    AI Customize
    KPI slide highlighting essential business metrics alongside color coded sections for quick reference and analysis.
    Add to Wishlist
    Download
    AI Customize
    Four colored semicircles for country data with percentages, and bottom section with three colorful circles for metrics.
    Add to Wishlist
    Download
    AI Customize
    KPI slide table with yearly financial data from FY16 to FY19 from operations to cash equivalents with placeholder text.