Find Our Collection Of Dashboard PPT Presentation Slides

Dashboard PowerPoint slide displaying three yellow speedometer style gauges with captions below.
P.ID : 17255
    112 views
    1 Downloads
    Get Custom Slides by Experts
    Instantly Access Templates in PowerPoint

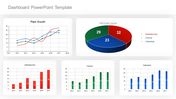
    Dashboard PPT Presentation Template


    Captivate your audience with our Dashboard PowerPoint template.

    Slide Description:

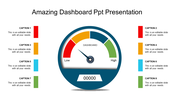
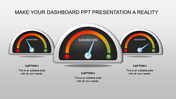
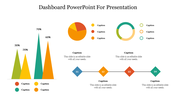
    Our template features a captivating slide that beckons you to explore. Three distinct dashboard dials, each like a compass pointing toward your goals. The yellow hue of these dials contrasts elegantly against the sleek grey background, ensuring that attention is drawn to your data.

    Customizable Dials: Each dial represents a key performance indicator (KPI) in your journey. Whether it’s revenue growth, customer satisfaction, or project milestones, these dials adapt to your needs. Edit them effortlessly, aligning them with your unique metrics.

    Editable Captions: Below each dial lies a blank canvas—a space for your insights. Explain the significance of the data, share trends, or highlight achievements.

    Intuitive Design: Professionals across industries, students aiming for top grades, or anyone seeking impactful presentations will find solace here.

    Who can Benefit?

    Business Professionals: Whether you’re a seasoned executive or a budding entrepreneur, these slides empower you. Use them in boardroom meetings, investor pitches, or project updates. Your data will speak volumes.
    Consultants and Analysts: Your insights deserve a stage. Use our slides to showcase findings, strategies, and recommendations. Your clients will appreciate the clarity.

    Download our Dashboard PPT templates now and embark on a journey where your stories are as compelling as your data!

    Features of the template:

    • Slides are available in 4:3 & 16:9
    • Get slides that are 100% customizable and easy to download
    • Highly compatible with PowerPoint and Google Slides.
    Advertisement

    You May Also Like These PowerPoint Templates

    Add to Wishlist
    Download
    AI Customize
    KPI dashboard highlighting supplier statistics using donut charts, order-to-invoice process, and bar charts.
    Free
    Add to Wishlist
    Download
    AI Customize
    A slide with a sleek dashboard design that includes colorful data visualizations like pie charts, graphs, and progress bars.
    Free
    Add to Wishlist
    Download
    AI Customize
    KPI slide displaying three circular meters with red, green, and orange sections, with text descriptions on the right.
    Add to Wishlist
    Download
    AI Customize
    Key Performance Indicators (KPI) scorecard template displaying various objectives in colored sections each with text area.
    Free
    Add to Wishlist
    Download
    AI Customize
    KPI PPT Template with three colourful circular progress charts  showing percentages, growth indicators, and  bar charts.
    Add to Wishlist
    Download
    AI Customize
    Executive summary dashboard featuring contract metrics, costs vs. revenue, and breakdowns by status, industry, and category.
    Free
    Add to Wishlist
    Download
    AI Customize
    Semi circular speedometer graphic with red to yellow gradient, and three placeholder text below.
    Add to Wishlist
    Download
    AI Customize
    RAG status slide with a task table featuring colored status indicators and four charts, including pie and line graphs.
    Add to Wishlist
    Download
    AI Customize
    KPI dashboard slide showing multiple charts, including bar, line, pie, and gauge charts with tracking business data.
    Free
    Add to Wishlist
    Download
    AI Customize
    KPI Template PPT Presentation Slide With Bar Chart
    Add to Wishlist
    Download
    AI Customize
    Four semi circular charts showing shipment percentages by country, with icons below for delivery status and order rates.
    Add to Wishlist
    Download
    AI Customize
    KPI report slide displaying software sales, downloads, and attendance metrics with speedometer gauges and growth indicators.
    Add to Wishlist
    Download
    AI Customize
    Logistics KPI PowerPoint Template and Google Slides
    Add to Wishlist
    Download
    AI Customize
    Two circular charts show metrics in red and green, representing key performance indicators for warehouse operations.
    Add to Wishlist
    Download
    AI Customize
    KPI slide highlighting essential business metrics alongside color coded sections for quick reference and analysis.
    Add to Wishlist
    Download
    AI Customize
    Four colored semicircles for country data with percentages, and bottom section with three colorful circles for metrics.
    Add to Wishlist
    Download
    AI Customize
    KPI slide table with yearly financial data from FY16 to FY19 from operations to cash equivalents with placeholder text.
    Add to Wishlist
    Download
    AI Customize
    Key performance indicator slide displaying data bars, percentages, and distinct icons in a structured layout.