Versatile Dashboard PPT Template for Business Analytics

Dashboard PowerPoint template displaying a donut chart, bar graph, line graph, and a text section for analysis.
P.ID : 17297
    191 views
    18 Downloads
    Get Custom Slides by Experts
    Instantly Access Templates in PowerPoint

    Dashboard PowerPoint Template and Google Slide


    Businesses using data dashboards can improve decision-making speed by up to 33%, according to Gartner.

    About the Slide

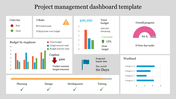
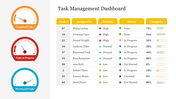
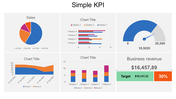
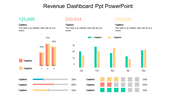
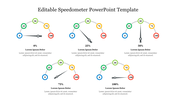
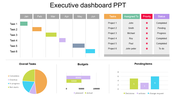
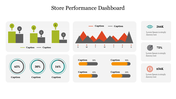
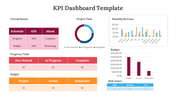
    The Dashboard PowerPoint slide is a key tool for modern businesses. It serves as a central hub for monitoring key metrics and data points, facilitating informed decision-making. This slide condenses complex information into visually appealing charts, graphs, and widgets, offering a comprehensive overview of performance and progress toward goals.

    Purpose of the Slide

    Whether tracking sales performance, monitoring project milestones, or analyzing marketing metrics, the fully editable slide allows for seamless customization to suit specific needs.


    Who Can Use It?

    This template is perfect for executives, managers, analysts, and educators. It helps enhance communication of insights, improve audience engagement, and save time.

    Download this Dashboard PowerPoint template today.

    Features of the template:


    • 100% customizable slides and easy to download.
    • The slides contain 16:9 and 4:3 formats.
    • Easy to change the colors quickly.
    • It is a 100% pre-designed slide.
    Advertisement

    You May Also Like These PowerPoint Templates

    Add to Wishlist
    Download
    AI Customize
    A project management dashboard slide featuring a table of test case data alongside visual graphs and planned progress.
    Add to Wishlist
    Download
    AI Customize
    Easily Editable Progress Dashboard Template
    Add to Wishlist
    Download
    AI Customize
    Circular dashboard graphic with five colored sections labeled surrounding a central gauge with a red needle.
    Add to Wishlist
    Download
    AI Customize
    Credit score meter with a needle in the center, displaying risk levels on a gradient from yellow to blue with caption areas.
    Free
    Add to Wishlist
    Download
    AI Customize
    Two speedometers with red and purple needle pointers, with caption and corresponding colored dots below.
    Add to Wishlist
    Download
    AI Customize
    3D sales chart displaying a 60 percent sales progress with an informative text section and interactive button on blue theme.
    Add to Wishlist
    Download
    AI Customize
    Colorful business analytics dashboard displaying bar graphs, line charts, and percentage indicators in a structured layout.
    Add to Wishlist
    Download
    AI Customize
    Dashboard template displaying a project timeline with a Gantt chart, project details, and phases from initiation to closure.
    Add to Wishlist
    Download
    AI Customize
    Dashboard layout with income, expenses, profit, and cash flow figures on the left, a project budget chart in the center.
    Add to Wishlist
    Download
    AI Customize
    Sales report slide showing metrics like sales volume, profit margin, and a gauge chart along with a bar graph.
    Add to Wishlist
    Download
    AI Customize
    Dashboard template with pink charts showing facebook and twitter activity, percentage rings, and a page growth graph.
    Add to Wishlist
    Download
    AI Customize
    KPI slide highlighting essential business metrics alongside color coded sections for quick reference and analysis.
    Add to Wishlist
    Download
    AI Customize
    Sentiment meter infographic displaying six emotions in a colorful fan design, each labeled with placeholders text areas.
    Add to Wishlist
    Download
    AI Customize
    KPI Dashboard PowerPoint template displaying key metrics, including count of contracts, revenues, and costs.
    Add to Wishlist
    Download
    AI Customize
    Tachometer template with percentage markers and color-coded designs, each paired with caption areas.
    Add to Wishlist
    Download
    AI Customize
    Four colored semicircles for country data with percentages, and bottom section with three colorful circles for metrics.
    Add to Wishlist
    Download
    AI Customize
    Key performance indicator slide displaying data bars, percentages, and distinct icons in a structured layout.