Dashboard PowerPoint Slides for Data Visualization

Speedometer dashboard PowerPoint slides showing three colored gauges with 25, 50, and 75 percent progress with captions.
P.ID : 18856
    692 views
    74 Downloads
    Get Custom Slides by Experts
    Instantly Access Templates in PowerPoint

    Dashboard PowerPoint Template and Google Slides

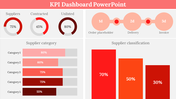
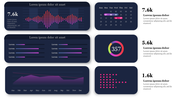
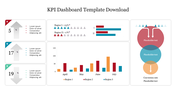
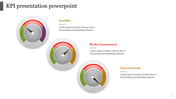
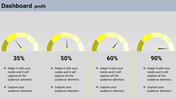
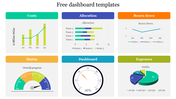
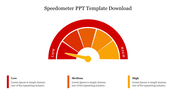
    The "Dashboard PowerPoint Template and Google Slides" features three speedometer dashboards, each displaying a different percentage. These dashboards serve as visual representations of progress, performance, or metrics, making complex data more easily understandable at a glance.

    This template is valuable for business professionals, project managers, analysts, educators, and anyone who needs to present data-driven insights or track progress toward goals. Whether you're reporting on project milestones, analyzing key performance indicators, or evaluating progress against targets, this template provides a clear and engaging visual aid.

    Compatible with PowerPoint and Google Slides, ensuring seamless integration into your presentation software of choice. Available in "16:9" and "4:3" aspect ratios and zip formats to suit various presentation preferences and screen resolutions. It is free to download and fully customizable. Download the Dashboard PowerPoint Template and Google Slides now.
    Advertisement

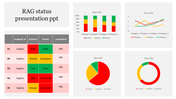
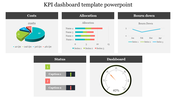
    You May Also Like These PowerPoint Templates

    Free
    Add to Wishlist
    Download
    AI Customize
    KPI dashboard slide showcasing various business metrics through colorful bar charts, pie charts, and a gauge meter.
    Add to Wishlist
    Download
    AI Customize
    Editable KPI Format PowerPoint And Google Slides Template
    Add to Wishlist
    Download
    AI Customize
    Three speedometer charts slide with captions indicating different data points, highlighted in green, yellow, and orange.
    Free
    Add to Wishlist
    Download
    AI Customize
    Free Dashboard PowerPoint Template Design template
    Add to Wishlist
    Download
    AI Customize
    Three semi circle gauges in pastel colors, with percentage labels above, and related text and icons beneath.
    Add to Wishlist
    Download
    AI Customize
     Download Speedometer PowerPoint Presentation Template
    Add to Wishlist
    Download
    AI Customize
    Multicolor Online Marketing Dashboard Template With Graph
    Add to Wishlist
    Download
    AI Customize
    Metrics Dashboard PowerPoint Template & Google Slides
    Free
    Add to Wishlist
    Download
    AI Customize
    Editable KPI Slide Template Presentation Slide
    Free
    Add to Wishlist
    Download
    AI Customize
    Creative Free KPI PowerPoint Presentation And Google Slides
    Free
    Add to Wishlist
    Download
    AI Customize
    Effective Project Dashboard PowerPoint Presentation
    Free
    Add to Wishlist
    Download
    AI Customize
    Project management dashboard slide showing various tasks in planning, design with workload, and budget charts.
    Free
    Add to Wishlist
    Download
    AI Customize
    KPI Dashboard Template PPT & Google Slides Presentation
    Add to Wishlist
    Download
    AI Customize
    Dashboard Speedometer Clipart PowerPoint PPT Template
    Free
    Add to Wishlist
    Download
    AI Customize
    Our Predesigned KPI PowerPoint And Google Slides Template
    Add to Wishlist
    Download
    AI Customize
    Dashboard slide showcasing project management KPIs with bar graphs, a line graph, and a pie chart in different colors.
    Add to Wishlist
    Download
    AI Customize
    Project management dashboard with charts for budget, progress, risks, workload, and projected launch date and icons.
    Add to Wishlist
    Download
    AI Customize
    The Best KPI Dashboard PPT And Google Slides Template