Effective Dashboard Model PowerPoint Slide Presentation

Dashboard Model PowerPoint slide showing statistics, graphs, and icons representing business data analysis.
P.ID : 61370
    620 views
    95 Downloads
    Get Custom Slides by Experts
    Instantly Access Templates in PowerPoint

    Effective Dashboard Model PowerPoint Slide Presentation

    Create an impressive presentation with this Effective Dashboard Model PowerPoint Slide Presentation. This is a well-designed template with a professional touch. This is a 100% user-friendly template. Use this pre-built template to save your time in presentation-making.

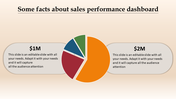
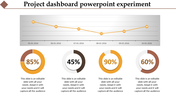
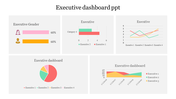
    Dashboards are easy to understand graphic representations of sales or performance data reports. This Effective Dashboard Model PowerPoint Slide Presentation is one of the best dashboard PPT templates from SlideEgg. This is a single nodded template.

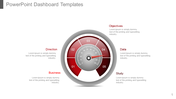
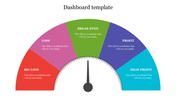
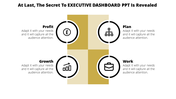
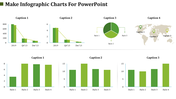
    This template has graphical clipart of charts representing the growth and position of the business. This template has many icons that are involved in the concepts of business. The node is placed on the left region of this template. It has a purple-colored background.

    Features of this template:

    • 100% customizable slides and easy to download.
    • Slides available in different nodes & colors.
    • The slide contained 16:9 and 4:3 format.
    • Easy to change the slide colors quickly.
    • Well-crafted template with instant download facility.
    • Stunning single node featured template.
    • Excellent template with premium features.
    Advertisement

    You May Also Like These PowerPoint Templates

    Add to Wishlist
    Download
    AI Customize
    Dashboard slide with three gauges displaying percentage levels, labeled low, middle, and high with placeholder text.
    Add to Wishlist
    Download
    AI Customize
    Dashboard overview slide displaying traffic, payment, server load, expenses, and product metrics using graphs and charts.
    Free
    Add to Wishlist
    Download
    AI Customize
    Bar graph comparing financial data with blue and purple theme, with a text box explaining a high level approach.
    Free
    Add to Wishlist
    Download
    AI Customize
    Six-layer bullseye diagram executive dashboard with annotations on each layer, arranged symmetrically around the circle.
    Add to Wishlist
    Download
    AI Customize
    Attractive Project Management Dashboard Slide Template
    Free
    Add to Wishlist
    Download
    AI Customize
    Green radial gauge with a modern layout, surrounded by five labeled rectangular sections on a neutral background.
    Add to Wishlist
    Download
    AI Customize
    Colorful dashboard PPT slide with world map, pie charts, bar graphs, and metrics with placeholder text.
    Add to Wishlist
    Download
    AI Customize
    Use Dashboard PPT Template Slide Designs
    Free
    Add to Wishlist
    Download
    AI Customize
    Dashboard template with three colorful gauge icons in the center and text boxes in green, blue, and gold.
    Free
    Add to Wishlist
    Download
    AI Customize
    PowerPoint slide with a project dashboard showing two speedometers to represent project progress with captions.
    Add to Wishlist
    Download
    AI Customize
    KPI dashboard with bar graphs showing data trends over time and two green summary boxes.
    Free
    Add to Wishlist
    Download
    AI Customize
    Dashboard PPT template featuring a speedometer with labeled sections like Direction, Objectives, Data, Business, and Study.
    Add to Wishlist
    Download
    AI Customize
    Vehicle dashboard slide featuring a speedometer on the left and a detailed table on the right with its brands.
    Add to Wishlist
    Download
    AI Customize
    KPI template showing a bar chart with four cases, and two circular progress indicators in blue and orange showing percentage.
    Add to Wishlist
    Download
    AI Customize
    A slide displaying dashboard elements like bar graphs, a world map with data points, and progress bars, with captions.
    Add to Wishlist
    Download
    AI Customize
    Marketing KPI dashboard comparing Google, Facebook, and Bing ads, featuring clicks, cost, line charts, and campaign analysis.