Credit Score Vs Credit Report PowerPoint And Google Slides

 Canva
Canva
Credit Score Vs Credit Report PowerPoint, Google Slides, and Canva Template
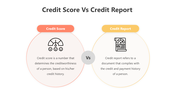
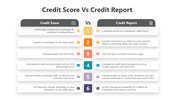
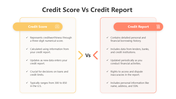
Understanding the difference between a credit score and a credit report is essential for managing financial health. A credit score is a three-digit number representing your creditworthiness, while a credit report is a detailed record of your credit history. This Credit Score vs. Credit Report presentation offers a clear, concise, and visually engaging comparison of these two key financial concepts.
Purpose Of The Slides
This presentation is designed to help users understand the distinctions between credit scores and credit reports. It highlights how credit scores are calculated based on credit report data and how credit reports provide detailed insights into payment history, credit accounts, and inquiries. The yellow and orange theme, combined with unique infographics, ensures clarity and engagement, making complex concepts easy to grasp.
Who Can Use It?
The Credit Score vs. Credit Report presentation is perfect for financial professionals, educators, and students. Whether you're a financial advisor explaining credit management to clients, a teacher educating students on personal finance, or a student preparing a presentation, this deck is an invaluable resource. It’s also ideal for individuals aiming to better understand their financial standing and improve their credit health.
Special Key Features
Empower your financial presentations with the Credit Score vs. Credit Report slides. Designed for seamless customization, this 13-slide deck is available in PowerPoint, Google Slides, and Canva. Simplify financial literacy and make an impact—download this vibrant and informative slide deck today!
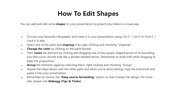
Features of this template
- 100% customizable slides and easy to download.
- The slides contain 16:9 and 4:3 formats.
- Easy to change the colors quickly.
- Highly compatible with PowerPoint, Google Slides, and Canva templates.


You May Also Like These PowerPoint Templates
Add to Wishlist
Download
AI Customize

Add to Wishlist
Download
AI Customize

Add to Wishlist
Download
AI Customize

Free
Add to Wishlist
Download
AI Customize


Add to Wishlist
Download
AI Customize

Add to Wishlist
Download
AI Customize

Add to Wishlist
Download
AI Customize

Add to Wishlist
Download
AI Customize

Add to Wishlist
Download
AI Customize

Add to Wishlist
Download
AI Customize

Add to Wishlist
Download
AI Customize

Add to Wishlist
Download
AI Customize

Add to Wishlist
Download
AI Customize

Add to Wishlist
Download
AI Customize

Add to Wishlist
Download
AI Customize

Add to Wishlist
Download
AI Customize

Add to Wishlist
Download
AI Customize


Add to Wishlist
Download
AI Customize
