Creative PowerPoint Charts Templates and Google Slides

Chart with five blue vertical bars showing percentages, paired with captions, on a white background.
P.ID : 7500
    498 views
    27 Downloads
    Get Custom Slides by Experts
    Instantly Access Templates in PowerPoint

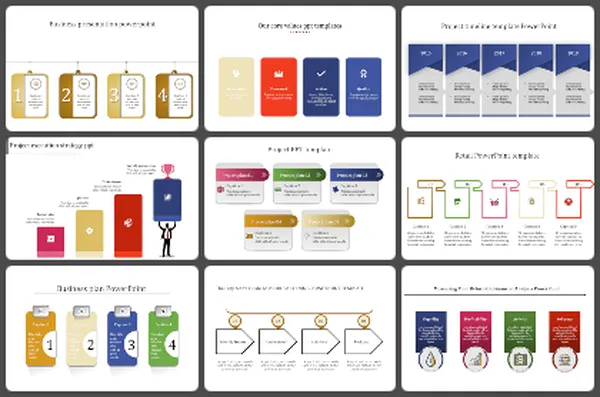
    Visualize Your Data Dynamically: Charts PowerPoint Templates


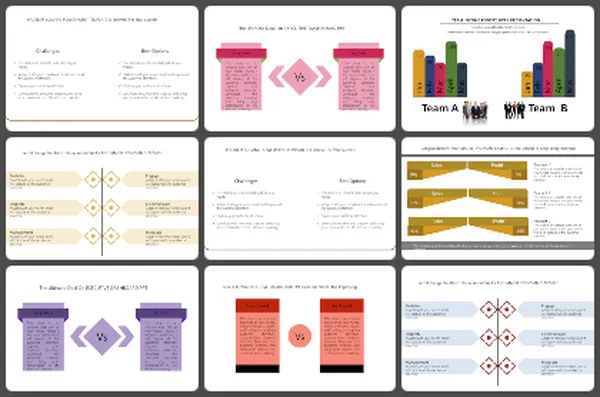
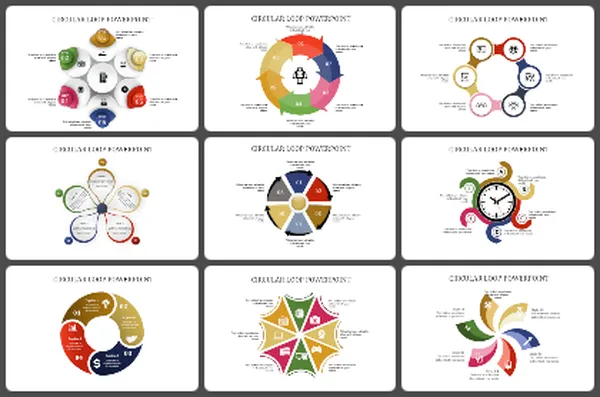
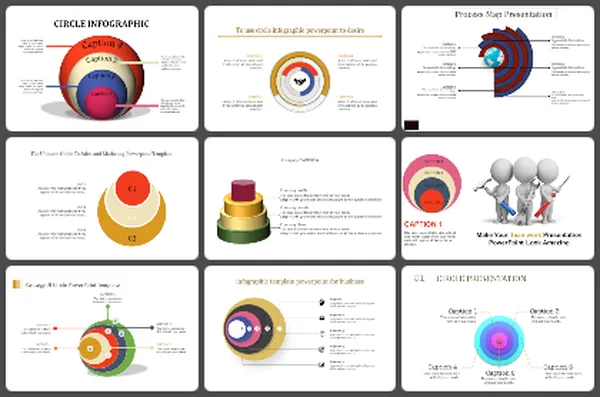
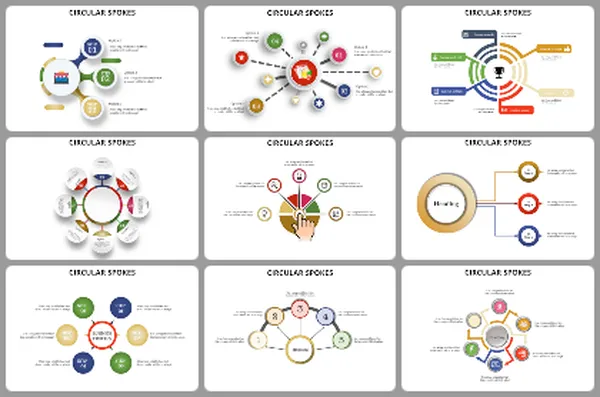
    Unlock the power of data visualization with our Creative PowerPoint Charts Templates and Google Slides Themes, tailored to elevate your presentations to new heights. This template features five sleek, blue-themed sliders, each boasting a customizable percentage level, along with a caption and text area for comprehensive data storytelling. Ideal for analysts, marketers, More...
    Advertisement

    You May Also Like These PowerPoint Templates

    Add to Wishlist
    Download
    AI Customize
    Area chart with overlapping blue, teal, and green sections, timeline on the axis, and three labeled boxes below.
    Add to Wishlist
    Download
    AI Customize
    Pie chart slide with four numbered pie charts in blue, maroon, orange, and red, each linked to a text box with labels.
    Add to Wishlist
    Download
    AI Customize
    Timeline chart template showing tasks across four years with segmented bars in yellow, red, and purple.
    Add to Wishlist
    Download
    AI Customize
    Yearly loss chart with six green bars and a line graph illustrating trends from 2014 to 2019.
    Add to Wishlist
    Download
    AI Customize
    A PowerPoint template displaying growth with stages represented by numbered circles showing data for different stages.
    Add to Wishlist
    Download
    AI Customize
    A slide with a line chart slide showing data for Category 1 to 2 over several years with placeholder text.
    Add to Wishlist
    Download
    AI Customize
    PowerPoint slide featuring four bar charts with different colors and captions, each representing different data percentages.
    Add to Wishlist
    Download
    AI Customize
    KWL chart slide with three light gray boxes, featuring maroon headers and side labels for knowledge tracking.
    Add to Wishlist
    Download
    AI Customize
    Color coded KWL chart template with sections for What I Know, What I Want to Know, and What I Learned with placeholder text.
    Add to Wishlist
    Download
    AI Customize
    Innovative Pie Chart Presentation Example Slide PPT
    Add to Wishlist
    Download
    AI Customize
    Scatter plot with differently sized bubbles in orange and purple, with a legend and product descriptions to the side.
    Add to Wishlist
    Download
    AI Customize
    Mekko chart displaying monthly data in sections, with colors indicating different categories from January to December.
    Add to Wishlist
    Download
    AI Customize
    3D bar chart with four vertical bars in blue, teal, purple, and yellow, with percentage labels and captions for each.
    Add to Wishlist
    Download
    AI Customize
    Pie chart slide showcasing six labeled segments in yellow and gray with surrounding icons, on a blue networked background.
    Add to Wishlist
    Download
    AI Customize
    Green color KWL chart presentation template with sections for What I Know, What I Want to Know, and What I Learned.
    Add to Wishlist
    Download
    AI Customize
    Executive dashboard slide displaying project details including start date, deadline, team members, and activities.