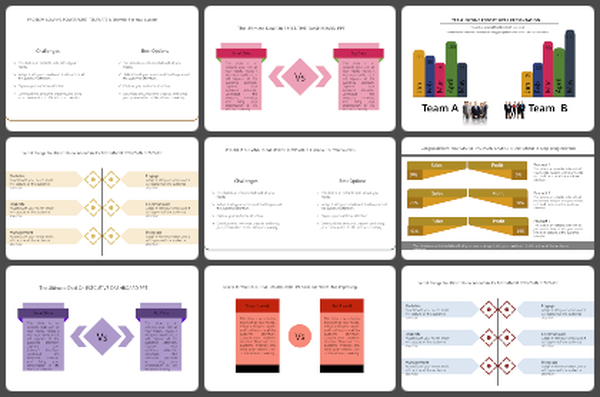
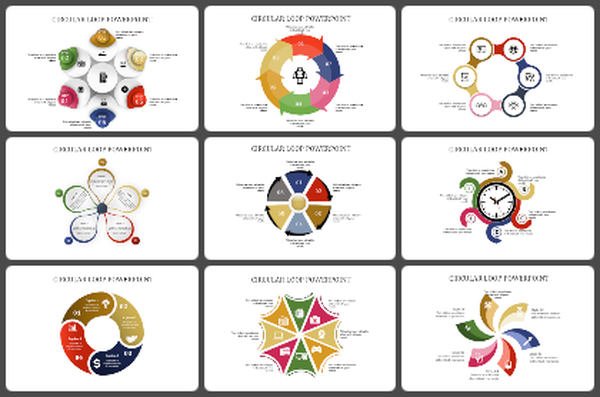
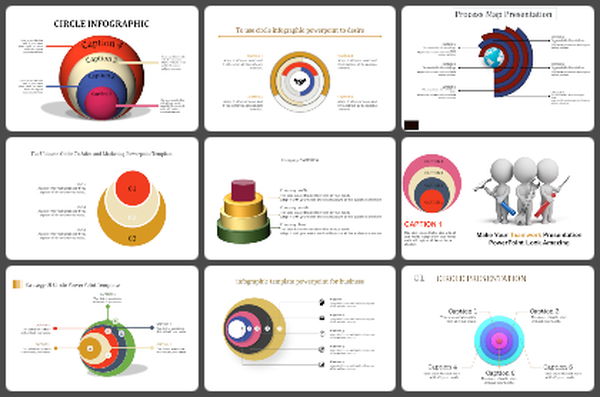
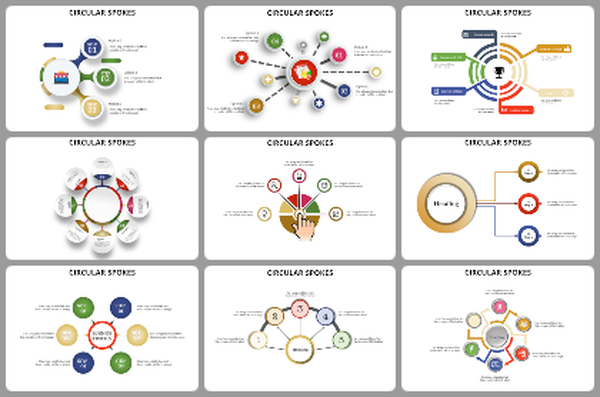
Best Creating Infographics In PowerPoint template and Google slides
Eight Nodded Creating Infographics In PPT Presentation
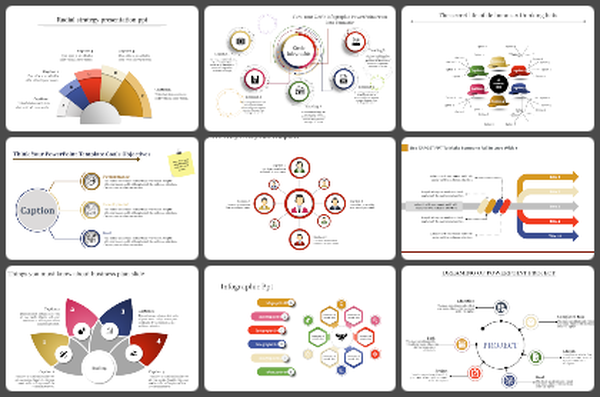
Ditch text overload! It just takes you a few minutes to make the best creating infographics in PPT with this template that works with both PowerPoint and Google Slides. Imagine a colorful sphere with eight sectors that can be used to visualize different data points, percentages, comparisons, or highlights in an aesthetically pleasing and informative way.
This template is the most convenient option for all who want to have the information presented visually; from teachers and marketers to presenters of any kind. No design skills needed! With the ready-made sections only, you can just insert your details and replace the visuals to see your infographic turning into an animation.
Infographics have been demonstrated as a remarkable means to draw the attention of the viewers and to break down the complex information. This blueprint will help you to create a clear, visually appealing and interesting infographic which can hold your audience’s attention. Now, download your infographic design template and turn your presentations into a living thing.
Features of the template
- 100% customizable slides and easy to download.
- The slides contain 16:9 and 4:3 formats.
- Easy to change the colors quickly.
- It is a well-crafted template with an instant download facility.
- It is a 100% pre-designed slide.
- The slide holds vibrant colors.
You May Also Like These PowerPoint Templates
Free
Free
Free


