Correlation PowerPoint Templates and Google Slides
Effective correlation Presentation
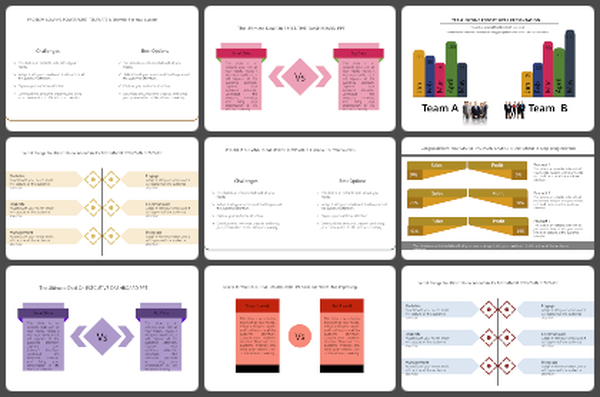
Correlation refers to the relationship between two variables, where a change in one variable is associated with a change in the other. The degree of correlation is measured by the correlation coefficient, which ranges from -1 to 1. A correlation coefficient of 1 indicates a perfect positive correlation, where an increase in one variable is always associated with an increase in the other. A correlation coefficient of -1 indicates a perfect negative correlation, where an increase in one variable is always associated with a decrease in the other. A correlation coefficient of 0 indicates no correlation, where the two variables are independent of each other. Correlation is an important concept in statistics and is used to understand and analyze relationships between variables in various fields such as finance, economics, psychology, and social sciences. By using our template, you can convey your message in a clear and concise manner.
Features of this Template
1. 100% customizable slides
2. easy to download.
3. The slide contained 16:9 and 4:3 format.
4. Well-crafted template with instant download facility.
5. Creative design with text area.


