Free - Circular Flow Chart Template and Google Slides Themes
Free

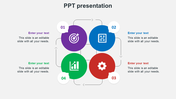

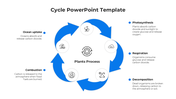
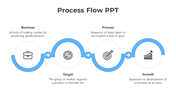
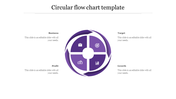

Circular Flow Chart Presentation Template
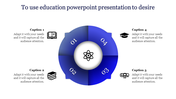
Explore the wonders of our Circular Flow Chart PPT and Google Slides. It's like a colourful magic wand that makes tricky economic ideas easy to understand. Imagine a big blue circular loop split into four smaller circles with directing symbols within each other and with a little picture that shows what's happening. Adding the icons makes the flowchart even better at showing information clearly. Just type in your words and pick the right pictures, then put them in a circle. It shows how things in business are connected and why they happen.
This template isn't just for people who know a lot; it's perfect for students too! You'll love how clear and pretty your presentations become. It Can be used in various settings such as classrooms, boardrooms, or consultations. It's like having a special tool for explaining economic ideas. Grab a business Circular Flow Chart today and see the difference!
Features of the template:
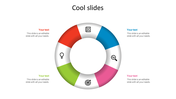
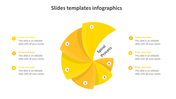
- Slides are available in different nodes & colors.
- Easy to change the slide colors.
- Well-crafted template with instant download.


You May Also Like These PowerPoint Templates
Add to Wishlist
Download
AI Customize

Add to Wishlist
Download
AI Customize

Add to Wishlist
Download
AI Customize

Add to Wishlist
Download
AI Customize

Free
Add to Wishlist
Download
AI Customize


Add to Wishlist
Download
AI Customize

Add to Wishlist
Download
AI Customize


Add to Wishlist
Download
AI Customize

Add to Wishlist
Download
AI Customize


Add to Wishlist
Download
AI Customize

Add to Wishlist
Download
AI Customize

Free
Add to Wishlist
Download
AI Customize


