A circle powerpoint template

A colorful Circle Powerpoint Template
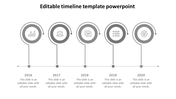
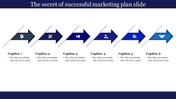
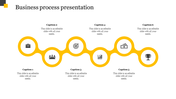
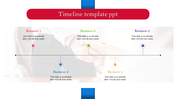
Download our creatively designed, customizable circle diagrams PowerPoint template to make significant and challenging data visualization to your audience. well-organized and understandable design. The PPTs have been created with good illustrations and images. The given icons, the best quality layouts, and well-researched content make them the preferred choice for all professionals and impress the audience.
About the template
Resizing and coloring the visual aids and text is not a big deal. You can download and use them for different purposes. Download this circular PowerPoint template and can do all the edits without external support. This PPT is 100% editable. You can efficiently utilize this to meet your presentation needs. You can also find more creative infographic templates at Slide Egg!
Feature of this Template
- The Slides are available in different nodes & colors.
- This slide contains 16:9 and 4:3 format.
- It is easy to change the slide colors quickly.
- It is a well-crafted template with an instant download facility
- The best PowerPoint theme template.
- It is a well-designed presentation template.
- Best circle PPT template for Presentation.


You May Also Like These PowerPoint Templates

Add to Wishlist
Download
Edit

Add to Wishlist
Download
Edit


Add to Wishlist
Download
Edit

Add to Wishlist
Download
Edit

Add to Wishlist
Download
Edit

Add to Wishlist
Download
Edit


Add to Wishlist
Download
Edit

Add to Wishlist
Download
Edit

Add to Wishlist
Download
Edit


Add to Wishlist
Download
Edit

Add to Wishlist
Download
Edit


Add to Wishlist
Download
Edit

Add to Wishlist
Download
Edit

