Amazing Circle Infographic PPT Template And Google Slides


Circle Infographic PowerPoint Template
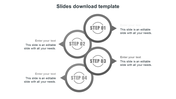
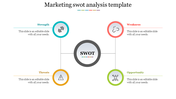
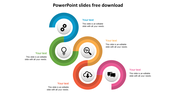
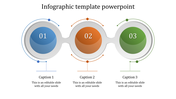
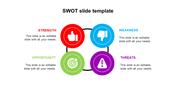
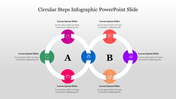
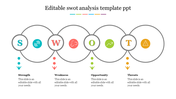
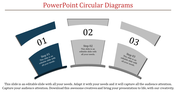
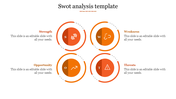
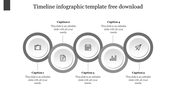
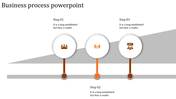
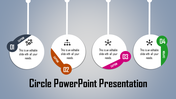
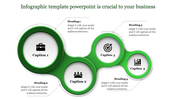
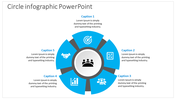
A Circle Infographic employs circles or circular elements to visually represent information, data, or concepts, often arranged in a radial layout. Marketers utilize it to illustrate market segmentation or product features, while project managers employ it for depicting timelines or workflows. Educators and trainers find value in using Circle Infographics to explain concepts or summarize information, and researchers utilize them to visualize data patterns or comparisons. The template offers customizable elements like circles, text boxes, and Multi Colors, allowing users to tailor the infographic to their specific needs. With its versatile design, the Circle Infographic template facilitates effective communication of complex ideas, data, or processes in a visually engaging manner across various fields and industries.
Features of this template
- 100% customizable slides and easy to download.
- The slide contains 16:9 and 4:3 formats.
- Easy to change the colors of the slide quickly.
- Highly compatible with PowerPoint and Google Slides.


You May Also Like These PowerPoint Templates
Add to Wishlist
Download
AI Customize

Add to Wishlist
Download
AI Customize

Add to Wishlist
Download
AI Customize


Add to Wishlist
Download
AI Customize


Add to Wishlist
Download
AI Customize

Add to Wishlist
Download
AI Customize

Add to Wishlist
Download
AI Customize

Add to Wishlist
Download
AI Customize

Add to Wishlist
Download
AI Customize


Add to Wishlist
Download
AI Customize

Add to Wishlist
Download
AI Customize


Add to Wishlist
Download
AI Customize

Add to Wishlist
Download
AI Customize


Free
Add to Wishlist
Download
AI Customize
