Free - Editable Chart Template PPT PowerPoint Presentation

Free
Layered area chart with Series 1 in yellow, Series 2 in orange, and Series 3 in black, showing data trends over time.
P.ID : 4203
    260 views
    49 Downloads
    Get Custom Slides by Experts
    Instantly Access Templates in PowerPoint

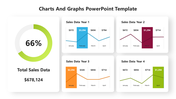
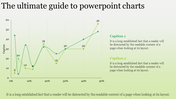
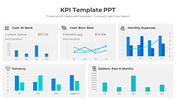
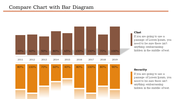
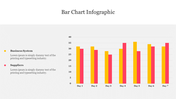
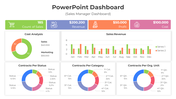
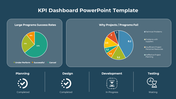
    Chart Template and Google Slides

    Unlock the potential of your presentations with a dynamic chart template in PowerPoint that seamlessly combines graph model design and professional shades of colors. Tailored for creative analysis and business presentations, this chart PPT template features a sleek two-node structure, lending a modern and polished aesthetic to your content. Elevate your data visualization game effortlessly with the "How to Quickly Edit Creative Chart Template Designs in PowerPoint" guide, ensuring that customization is swift and straightforward. Perfect for professionals seeking impactful visual elements in their presentations, this template strikes the ideal balance between creativity and functionality, making your data not only informative but also visually compelling.

    Feature of the template

    • 100% customizable slides and easy to download.
    • Slides available in different nodes & colors.
    • The slide is contained in 16:9 and 4:3 format.
    • Easy to change the slide colors quickly.
    • Well-crafted template with instant download facility. 
    Advertisement

    You May Also Like These PowerPoint Templates

    Add to Wishlist
    Download
    AI Customize
    Project management dashboard slide showing colored charts for net worth, sector allocation, and various financial metrics.
    Add to Wishlist
    Download
    AI Customize
    Color coded Gantt chart slide outlining a yearly project timeline with quarterly milestones and description boxes.
    Add to Wishlist
    Download
    AI Customize
    Circular chart with seven pastel colored segments, each with  icons and captions around it.
    Add to Wishlist
    Download
    AI Customize
    Gantt chart slide showing a project timeline with tasks categorized into colorful sections, represented by horizontal bars.
    Add to Wishlist
    Download
    AI Customize
    Project management dashboard slide with visually colored charts and graphs displaying task status with icons.
    Add to Wishlist
    Download
    AI Customize
    Modern Bar Chart PPT Template and Google Slides Themes
    Add to Wishlist
    Download
    AI Customize
    Creative KPI Scorecard PowerPoint Template Slide PPT
    Add to Wishlist
    Download
    AI Customize
    Dashboard PowerPoint Template and Google Slides
    Add to Wishlist
    Download
    AI Customize
    Row of four colored speedometer-style gauges, each showing varying percentages with needle, and captions at the bottom.
    Free
    Add to Wishlist
    Download
    AI Customize
    Blue Theme KPI Presentation Template PPT Slide
    Add to Wishlist
    Download
    AI Customize
    Editable Traction PowerPoint PPT Presentation Template
    Add to Wishlist
    Download
    AI Customize
    Digital Dashboard Designed KPI PowerPoint Template
    Free
    Add to Wishlist
    Download
    AI Customize
    Colorful bar chart with three data categories and corresponding bars each with caption areas.
    Add to Wishlist
    Download
    AI Customize
    Six semicircular gauges with colored indicators in red, purple, blue, yellow, pink, and green on a white backdrop.
    Free
    Add to Wishlist
    Download
    AI Customize
    Slide showcasing three different types of colored charts an area chart, a bar chart, and a line chart, with captions below.
    Add to Wishlist
    Download
    AI Customize
    Three pie charts with segmented sections and percentage labels, each chart featuring placeholder text below.
    Add to Wishlist
    Download
    AI Customize
    Get Pie Chart PowerPoint Template  With Red Background