Effective Chart PPT Presentation Template Design

Chart slide showing monthly bar graphs split into two sections and pie charts highlighting four color-coded items.
P.ID : 4171
    437 views
    37 Downloads
    Get Custom Slides by Experts
    Instantly Access Templates in PowerPoint

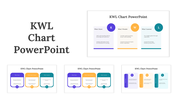
    Interactive Chart PPT Template

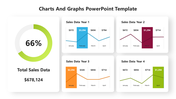
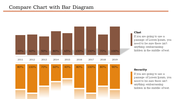
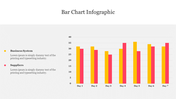
    Unlock the power of data visualization with our Chart PPT Template! Check out our detailed patterns! Two identical slides and each is a canvas waiting to be explored. Green headers and footers maintain business excellence, and that sets the stage for the future. The bar chart: a visual symphony of monthly data, from snowy January to Sun December. Gradually shades of green make trends pop, making sure your audience doesn’t miss a beat.

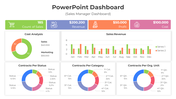
    Pie Chart: Below the bar chart is the pie chart—deliciously clear. Quadrants labeled “Item 1”, “Item 2” and others divide complex information into bite-sized skewers. Whether you’re a seasoned executive, data analyst, or marketing professional, our PPT simplifies getting your message across. Witness the change by downloading our templates and Google Slides Themes now. Your audience is waiting—let’s create a winning strategy!

    Features of the template:

    •  Slides are available in 4:3 & 16:9
    • Well-crafted template with instant download.
    • Get slides that are 100% customizable and easy to download
    Advertisement

    You May Also Like These PowerPoint Templates

    Add to Wishlist
    Download
    AI Customize
    Editable KPI Dashboard PowerPoint And Google Slides
    Add to Wishlist
    Download
    AI Customize
    Bar Graph PPT Template and Google Slides Presentation
    Add to Wishlist
    Download
    AI Customize
    Effective Pie Chart Template Presentation-Four Node
    Free
    Add to Wishlist
    Download
    AI Customize
    Unique KWL Chart PPT Presentation Template and Google Slides
    Free
    Add to Wishlist
    Download
    AI Customize
     circled pie chart presentation  with arrows
    Free
    Add to Wishlist
    Download
    AI Customize
    Innovative Multiple Chart PowerPoint And Google Slides
    Free
    Add to Wishlist
    Download
    AI Customize
    High Quality PowerPoint Templates and Google Slides
    Add to Wishlist
    Download
    AI Customize
    Project management dashboard slide showing colored charts for net worth, sector allocation, and various financial metrics.
    Add to Wishlist
    Download
    AI Customize
    Color coded Gantt chart slide outlining a yearly project timeline with quarterly milestones and description boxes.
    Add to Wishlist
    Download
    AI Customize
     Sales And Marketing Strategy Template	in Chart Model
    Add to Wishlist
    Download
    AI Customize
    Circular chart with seven pastel colored segments, each with  icons and captions around it.
    Add to Wishlist
    Download
    AI Customize
    Gantt chart slide showing a project timeline with tasks categorized into colorful sections, represented by horizontal bars.
    Add to Wishlist
    Download
    AI Customize
    Chart PowerPoint Template and Google Slides
    Add to Wishlist
    Download
    AI Customize
    Successive Growth Chart Template PowerPoint Presentation
    Add to Wishlist
    Download
    AI Customize
    Project management dashboard slide with visually colored charts and graphs displaying task status with icons.
    Add to Wishlist
    Download
    AI Customize
    Modern Bar Chart PPT Template and Google Slides Themes
    Add to Wishlist
    Download
    AI Customize
    Creative KPI Scorecard PowerPoint Template Slide PPT
    Add to Wishlist
    Download
    AI Customize
    Dashboard PowerPoint Template and Google Slides
    Add to Wishlist
    Download
    AI Customize
    Row of four colored speedometer-style gauges, each showing varying percentages with needle, and captions at the bottom.