Stunning Chart Template PPT Presentation Slide Design

 Canva
Canva

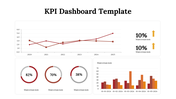
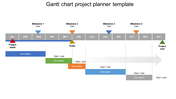
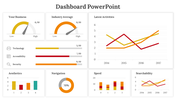
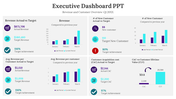
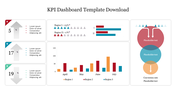
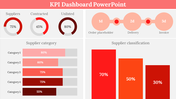
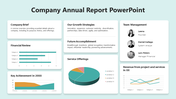
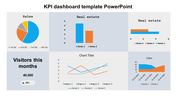

Chart presentation Slide
Using our Chart Template Plan Presentation Slide as a foundation, you can start the path of data-driven excellence and make well-informed company decisions. Imagine yourself at an executive level, about to present a strategy that will change the game. When you click on the Chart Template slide, the room falls silent and the story starts.
This dynamic slide provides a thorough representation of your main data with three attractive pie charts and a line chart. You may easily adapt the facts to fit your story. Pie charts provide a clear picture of proportional connections by skillfully dividing complex information into smaller portions. Concurrently, the line graph illustrates patterns throughout time, offering a strategic summary of your progress. Your audience will find reading even the most complex facts engaging because of the design's ease of use.
Decision-makers, analysts, and executives in any sector need to communicate complicated information. This slide helps to develop comprehension and facilitate strategy talks by simplifying complex reports, whether you're discussing financial performance, market share, or project schedules. The power of visual storytelling can elevate your presentations and engage your audience.
Are you prepared to turn your facts into an engaging story? Put your company on the road to success by downloading our Chart Template Strategy Presentation Slide right now. Your audience is waiting for the clarity and wisdom that will propel the story.
Features of the Templates
- Completely adaptable.
- The slide show is in 4:3, 16:9, zip format.
- There is powerful connectivity with Google Slides and PowerPoint.
- It is simple and quick to alter the slide's color.
- An efficient template that can be easily accessed immediately.
- Easy to Download.


You May Also Like These PowerPoint Templates
Add to Wishlist
Download
AI Customize

Free
Add to Wishlist
Download
AI Customize

Free
Add to Wishlist
Download
AI Customize


Add to Wishlist
Download
AI Customize


Add to Wishlist
Download
AI Customize

Add to Wishlist
Download
AI Customize

Add to Wishlist
Download
AI Customize

Add to Wishlist
Download
AI Customize

Add to Wishlist
Download
AI Customize


Add to Wishlist
Download
AI Customize

Add to Wishlist
Download
AI Customize

Add to Wishlist
Download
AI Customize

Add to Wishlist
Download
AI Customize

Add to Wishlist
Download
AI Customize

Add to Wishlist
Download
AI Customize


Add to Wishlist
Download
AI Customize
